The S&P 500 notched its 11th record high of the year, leading a positive trend across major U.S. stock indexes, despite mixed economic indicators and a volatile week. Closing at 5,029.73, the index was up by 0.58%, with the Nasdaq and Dow Jones also finishing in the green, buoyed by standout performances from companies like Tesla, Meta Platforms, and Wells Fargo. This rebound comes amidst a backdrop of fluctuating retail sales data, uneven earnings reports, and shifting currency markets, highlighting the stock market’s resilience even as it navigates through economic uncertainties and global financial dynamics. The week’s events underscore the complex interplay between consumer strength, corporate health, and international economic policies, painting a multifaceted picture of the current financial landscape.
The S&P 500 achieved a new record high, with all three major stock indexes, including the Nasdaq Composite and the Dow Jones Industrial Average, finishing in positive territory on Thursday. This recovery marks the S&P 500’s 11th record high of the year, as it managed to rebound from significant losses earlier in the week. The S&P 500 rose by 0.58% to close at 5,029.73, the Nasdaq Composite increased by 0.30% to 15,906.17, and the Dow Jones surged 0.91%, adding 348.85 points to close at 38,773.12. Notable performers included Tesla and Meta Platforms, with shares up 6% and 2% respectively, and Wells Fargo, which saw a 7% increase after a penalty from the Office of the Comptroller of the Currency was lifted.
Despite the positive close, the week presented mixed signals about the U.S. economy’s health and corporate America’s outlook. Retail sales in January fell by 0.8%, exceeding economists’ expectations of a 0.3% decline, fueling concerns about consumer strength amidst persistent inflation and high-interest rates. The earnings season has been inconsistent, with Tripadvisor’s shares jumping 9% after surpassing estimates. In comparison, Cisco faced a 2% decline after announcing layoffs and a dim sales forecast, and Deere’s stock fell 5% following a reduction in its full-year profit guidance. These developments came in a week marked by volatility, with the Dow experiencing its biggest one-day loss since March 2023 earlier in the week, yet it, along with the S&P 500, is set to end the week with slight gains, whereas the Nasdaq is projected to record a loss.
Data by Bloomberg
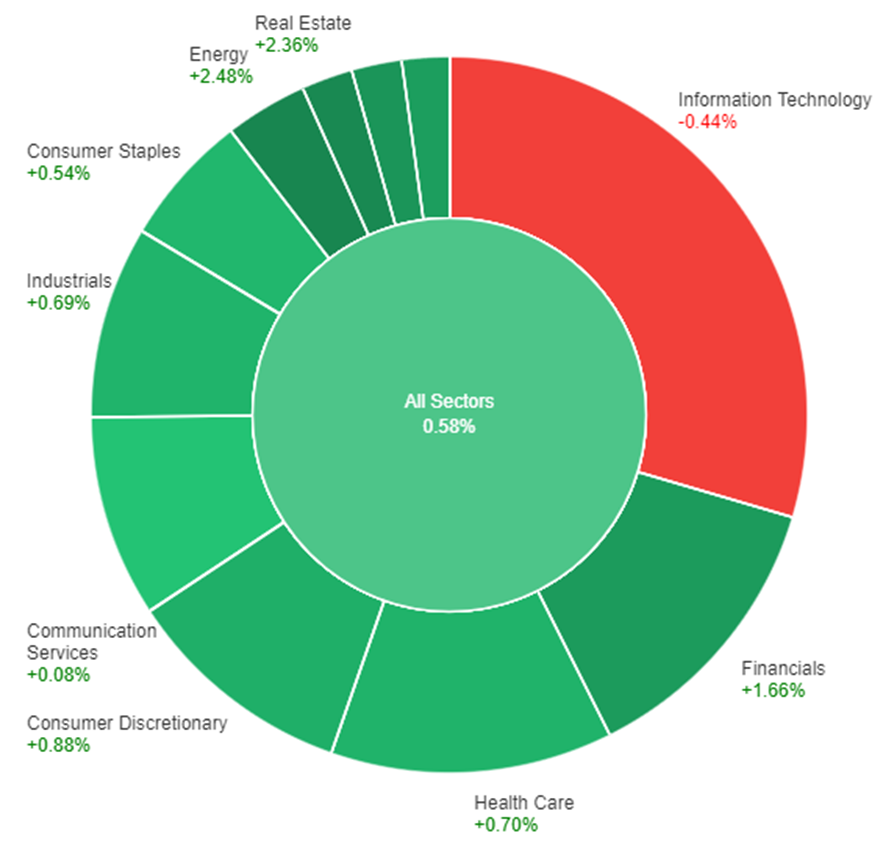
On Thursday, the overall market showed a positive trend with all sectors combined gaining +0.58%. The energy sector led the gains with a significant increase of +2.48%, closely followed by the real estate and materials sectors, which rose by +2.36% and +1.88%, respectively. Other sectors such as financials, utilities, consumer discretionary, and health care also saw increases, with financials up by +1.66% and health care by +0.70%. Industrials and consumer staples recorded modest gains. However, the communication services sector barely moved with a +0.08% increase, while the information technology sector was the only one to decline, dropping by -0.44%.
In the currency markets, the U.S. dollar experienced a significant downturn following unexpectedly weak January retail sales, dropping 0.8% against a forecasted 0.1% decrease. This initial reaction was somewhat mitigated as the data’s validity was questioned due to potential seasonal adjustments and adverse weather conditions. Despite this, the dollar managed to recover slightly from its lowest points. Contributing to the economic landscape were other indicators like initial jobless claims and various regional Fed data, suggesting a stronger-than-anticipated economic performance and higher inflation signals. This mixed economic feedback, along with a recovery in two-year Treasury yields from initial drops, painted a complex picture of the U.S. financial health, influencing currency valuations.
Internationally, the currency markets saw movements influenced by the U.S. data and other global economic indicators. The USD/JPY pair declined by 0.4%, yet it remained above its recent lows, indicating resilience amidst broader trends and speculation about Japan’s monetary policy challenges. Meanwhile, the EUR/USD pair rose by 0.3%, buoyed by European Central Bank (ECB) policymakers’ resistance to rate cuts and market anticipations around monetary policy adjustments. The British pound also saw a modest increase, benefiting from the U.S. retail sales report’s fallout and optimistic comments from Bank of England officials. These currency movements underscore the interconnectedness of global economic indicators and central bank policies, with investors closely monitoring various data points and policy statements for future direction.
EUR/USD nears key level amid speculation of Fed rate cut
A moderate decline in the US dollar, coupled with a decrease in US bond yields, has pushed the EUR/USD pair closer to the significant 1.0800 level. This movement is underpinned by market speculation of a potential Federal Reserve interest rate cut later this year, with a 40% chance in May and nearly 50% in June according to the CME Group’s FedWatch Tool. The speculation gains ground following higher-than-expected US inflation data, despite strong fundamentals and a tight labor market. On the European side, ECB President Christine Lagarde points to strong wage pressures and a commitment to achieving a 2% inflation target, amidst the European Commission’s downward revision of eurozone GDP growth for 2024 and expectations of decelerating inflation.
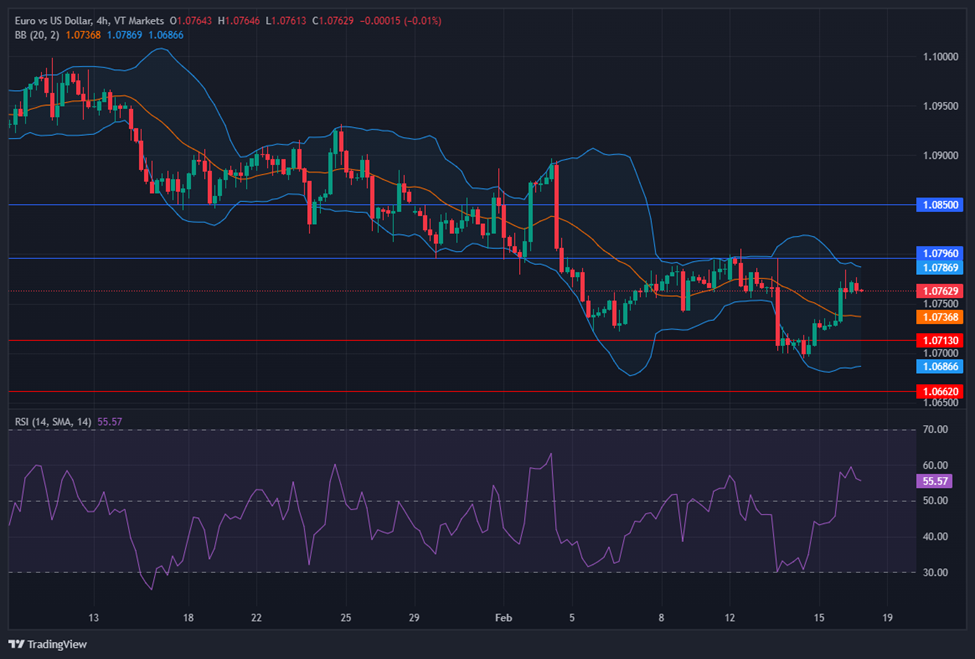
On Thursday, the EUR/USD moved higher and was able to reach near the upper band of the Bollinger Bands. Currently, the price is moving between the upper and middle band, suggesting a potential slightly upward movement to reach above the upper band. Notably, the Relative Strength Index (RSI) maintains its position at 55, signaling a neutral outlook for this currency pair.
Resistance: 1.0796, 1.0850
Support: 1.0713, 1.0662
XAU/USD struggle to hold the $2,000 mark amid mixed US economic indicators
Gold prices saw an increase on Thursday, reaching a peak of $2,008.30, driven by a weakening US Dollar and mixed economic data from the United States. Despite an initial surge, XAU/USD lost momentum throughout the trading session, struggling to maintain its position above the $2,000 threshold. The decline in retail sales by 0.8% for January, significantly below the expected 0.1%, and a slight improvement in initial jobless claims did not suffice to sustain early gains. However, improvements in manufacturing indices from New York and Philadelphia offered some positive economic signals. These developments led to fluctuating government bond yields and a partial recovery in the US Dollar, affecting gold prices amidst a complex economic backdrop.
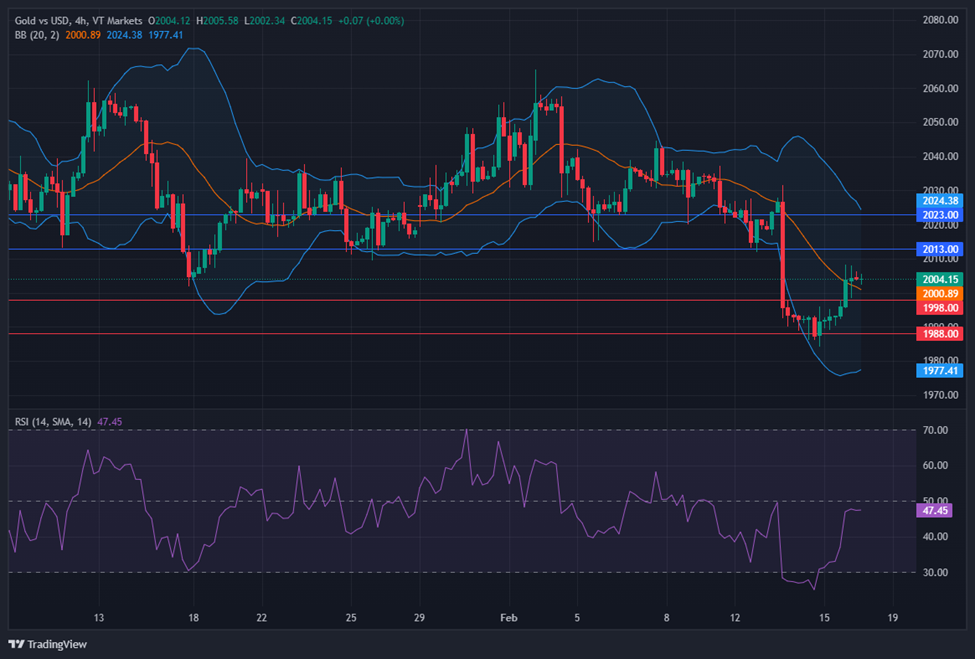
On Thursday, XAU/USD moved higher and was able to reach above the middle band of the Bollinger Bands. Currently, the price is moving slightly above the middle band, suggesting a potential upward movement to reach the upper band. The Relative Strength Index (RSI) stands at 47, signaling a neutral outlook for this pair.
Resistance: $2,013, $2,023
Support: $1,998, $1,988
| Currency | Data | Time (GMT + 8) | Forecast |
|---|---|---|---|
| GBP | Retail Sales m/m | 15:00 | 1.5% |
| USD | Core PPI m/m | 21:30 | 0.1% |
| USD | PPI m/m | 21:30 | 0.1% |
| USD | Prelim UoM Consumer Sentiment | 23:00 | 80.0 |