


Daily Market Analysis
Market Focus
On Monday, Stocks trimmed losses as a rebound in tech giants tempered concern over cloudy prospects for more economic stimulus and a report detailing suspicious transactions at global banks. Treasuries and the dollar climbed.
After approaching the threshold that many investors consider to be a market correction, the S&P 500 came off session lows as the Nasdaq 100 climbed. Commodity, industrial and financial shares still led the benchmark gauge to its lowest in almost two months. American Airlines Group Inc. paced losses in travel companies on worries that an increase in virus cases could prompt further lockdown measures.
Equities extended their September selloff, while the eruption of a partisan battle over replacing Supreme Court Justice Ruth Bader Ginsburg damaged already-slim prospects for another round of fiscal stimulus. Speaker Nancy Pelosi and House Democrats released a stopgap government funding bill without support from the White House or Senate Republicans — raising the risk of a federal shutdown at the end of the month.
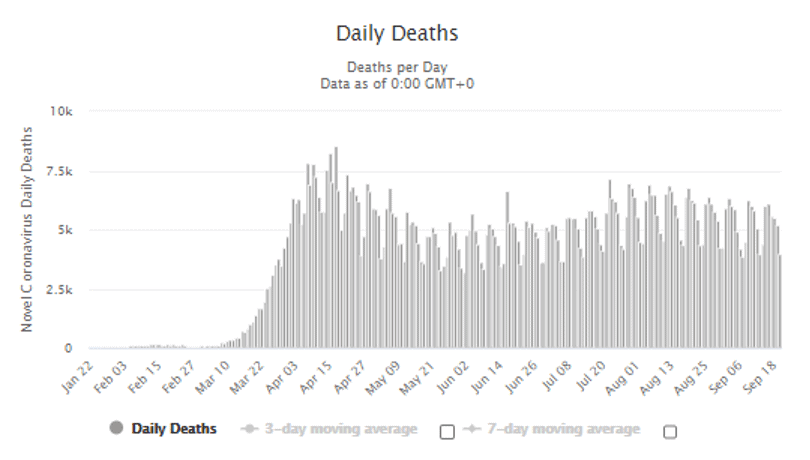
As U.S. deaths related to Covid-19 approached 200,000, former Food and Drug Administration Commissioner Scott Gottlieb said he expects the nation to experience “at least one more cycle” of the virus in the fall and winter. Germany’s health minister warned that the trend of cases in Europe is “worrying” amid expectations that restrictions could soon be extended to London.
Market Wrap

Main Pairs Movement
Greenback advanced by the most in three months as a slump in global stock markets and concern about rising Covid-19 cases drove demand for haven assets. The greenback surged up all of its major developed-market peers and DXY index hovered .6% around the end of the trading day and putting it on course for its largest one-day rally since June. Japanese yen and the Swiss franc that both often seen as haven currencies also outperformed riskier counterparts.
Data from the CFTC which shows positioning through last Tuesday had also indicated an accompanying increase in speculative positioning against the greenback. Meanwhile, treasuries climbed, implied volatilities rose across currencies and tenors on political uncertainty in the U.S.
COVID-19 Data (EOD):


Technical Analysis:
GBPUSD(H4)

GBPUSD is trading around 1.2820 region, which wiped off the last consolidation. Sterling was hit by comment of concern amid second wave of the virus pandemic, official member who said that if current trend of rising cases continue then it will expect to outstrip 50k in mid-Oct. according to statement, U.K. Prime Minister is reportedly considering another national two-week lockdown to stop the outbreak happen. For short-term technical outlook, it seems constitue a range-walk in consolidation tunnel between 1.277 and 1.3 as the codify cap and floor.
Resistance: 1.2847, 1.3
Support: 1.2775, 1.2717
USDJPY (H4)

Loonie pair broke above 1.33 on Monday which touched its highest level in six weeks at 1.3321. meanwhile, there is no majority eco news, but the broad-based USD strength combined with the heavy crude oil sell off today that fueled it went up. Moreover, loonie breakthrough a critical resistance at 1.325 around that prop up the market position to another bullish momentum. For RSI indicator, its once approach 70 as a over bought zone then back down a little bit to 69 around while writing.
Resistance: 1.3349, 1.3388
Support: 1.3248, 1.32
XAUUSD (H4)

Gold currently trading at 1912 which rebound from intraday low in 1882 and its worst performance since last month. However, gold market surprisingly slipped while risk-off sentiment spread in global shares market. As the yesterday movement, it almost tested last lowest level in August beginning in 1863. On the other hands, RSI index reverse from over sought area to 32 but short-term and long-term MA is consecutive upwind at the moment.
Resistance: 1921.68, 1940.84
Support: 1902.7, 1881.58
Economic Data


