Daily Market Analysis
Market Focus
Markets are relatively quiet on the last day of 2020, with global stocks indexes remaining near record highs and the dollar at the weakest level in two years. US markets fluctuate between small gains and losses as volumes are subdued, about 40% below average for the time of day.
China and the European Commission has officially announced the comprehensive agreement on investment, granting each region’s businesses better access to each other’s market. At the same time, this agreement also will significantly improve the level playing field for EU investors on Chinese state- owned enterprises, prohibiting forced technology transfers and other distortive practices, and enhancing transparency of subsidies.
Wall Street revives hope on Bitcoin ETF with new SEC filing after several rejection for years. VanEck Associates Corp. has started a new push to launch an ETF tracking Bitcoin as VanEck may be betting that a change in SEC leadership, with Jay Clayton stepping down and the new SEC chairman having a softer line. According to the recent filing, VanEck’s ETF plans to hold Bitcoin and is going to value its shares based on prices.
Market Wrap
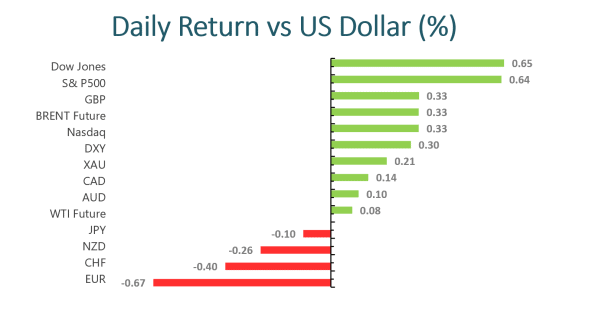
Main Pairs Movement
The Euro dollar gives up some ground against the greenback after reaching a fresh 2020 high yesterday. The EUR/USD pair is down as profit- taking after a new high. The greenback remained the doubtful honor of being the weakest currency across the foreign currency board, undermined by virus concerns.
The British Pound strengthens against the greenback after Brexit agreement. As the year of 2020 approaches to an end, the British government is confident for significant changes at the boarder with the EU in 2021. However, the economic outlook for the pair remains bleak as the trade deal seems to not extend to services or the financial industry; in the meantime, there is concerns on Scotland, which voted to remain in the EU in 2016, could seek to leave the UK. Thus, despite the British Pound remains relatively well supported in 2021, it is hard to say that there are not serious doubts about the road ahead.
Technical Analysis:
EURUSD (Daily Chart)
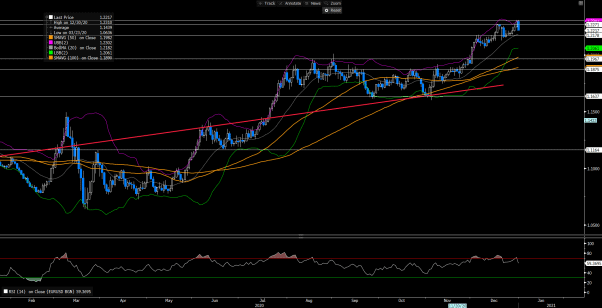
The EUR/USD pair manages to touch the first target at 1.2305 and attempts to breach it. The pair remains bullish since the bullish channel and the SMAs continues to push the price to achieve more gains. Bullish momentum will get discouraged if the pair retreats to 1.2178, 1.2000 threshold, but should be an adjustment unless the pair falls all the way to 1.1875, 1.18 threshold.
Resistance: 1.2305
Support: 1.2271, 1.1967, 1.1875
GBPUSD (4 Hour Chart)
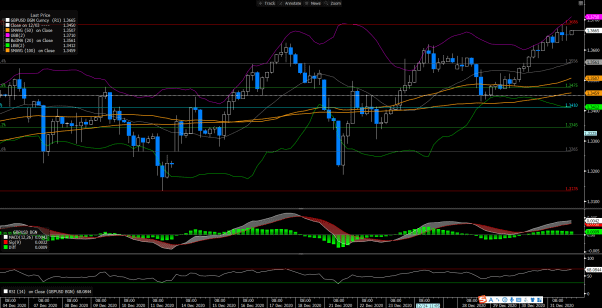
On the 4- hour chart, the GBP/USD pair continues to climb up as the year of 2020 comes to an end. The pair manages to contest the resistance of 1.3672, and is expected to see a correction in the price range from 1.3673- 1.3602. At the same time, the RSI indicator also shows an overbought condition, which will bring the pair down a little as well as suggested by Bollinger Band, currently trading on the upper bound. Overall, the bullish condition is optimistic as it is well located above the 50 SMA and the 100 SMA.
Resistance: 1.3686
Support: 1.3602, 1.3556, 1.3475
NZDUSD (4 Hour Chart)
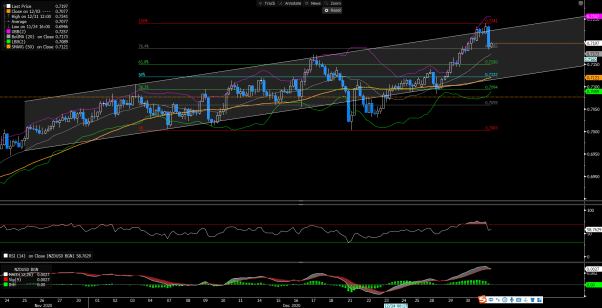
The NZD/USD pair continues to stay in the bullish channel despite of a sudden pullback after contesting the resistance of 0.7241. The pair remains above the 50 SMA and above the mean of Bollinger Band on the 4-hour chart. It is expected to see the pair continues to rise after the RSI indicator drops below the overbought region. As of now, the pair resumes its bullish rally to move away from the support of 0.7485, reinforcing the expectations of continuing the main bullish trend, which its next target located at 0.7241.
Resistance: 0.7241
Support: 0.7185, 0.7150, 0.7122
Economic Data
Click here to view today’s important economic data.