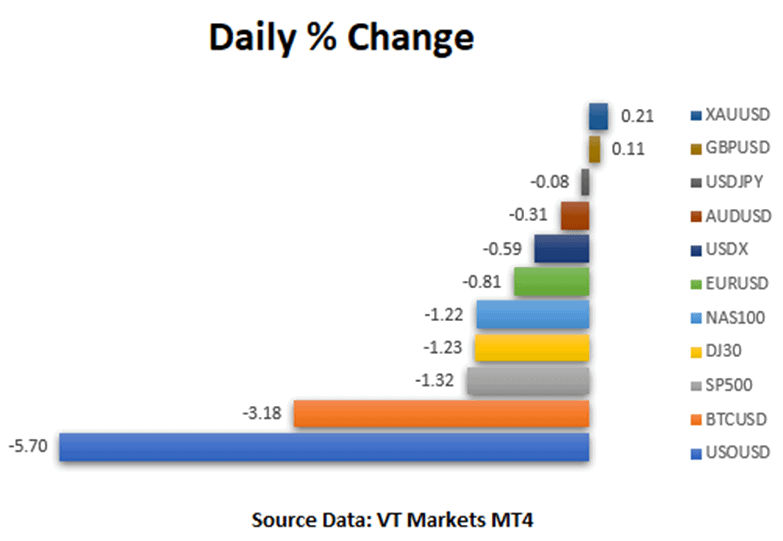
Although this month was a favorable month for US equity, quarterly it decreased mostly owing to the FED’s threat to reduce inflation and affected by conflict situations in Ukraine. According to MT4 VT Markets data, the SP500 was down 1.32 percent daily and down 5 percent quarterly, the NAS100 was down 1.22 percent and down 9.08 percent quarterly, and the DJ30 was down 1.23 percent and down 4.58 percent quarterly.

Today’s US jobs report will be the market’s focus, as it is one of the statistics that will support a judgment on whether the FED is likely to hike interest rates by 50 basis points in May, to combat increasing inflation. The consumer price index (CPI) reached 7.9 percent, the highest level in 40 years. The FED’s Core PCE statistics jumped to 5.4 percent, significantly over the central bank’s target of 2 percent. Several US central bank governors, including Fed Chair Jerome Powell, have signaled in recent weeks that they are open to the possibility of a 0.5 percent rate hike, so the non-farm employment change data is critical to monitor.
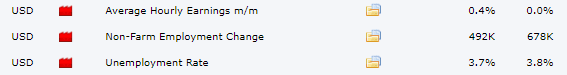
Many analysts anticipate a 492K gain this month (estimate from forex factory), which is a significant increase but still falls short of last month’s 678K. The unemployment rate is expected to fall to 3.7 percent from 3.8 percent, while average hourly earnings are expected to rise 0.4 percent from 0.0 percent last month.

Main Pairs Movement
Several technology companies continued to fall; AAPL fell 1.04 percent to $175.95, INTEL fell 2.56 percent to $50, NVIDIA fell 0.65 percent to $275.73, and TSLA fell 0.69 percent to $1086. 29
USOUSD (WTI Texas) momentarily dipped below $100, or as much as 5.70 percent, as a result of US President Joe Biden’s directive to unleash US oil reserves and push drillers to raise output.
The USDX (USD Index) plummeted as high as 0.59 percent, signaling that the USD is weakening. However, due to concerns about the conflict in Ukraine, the EURUSD plummeted as much as 0.81 percent on Thursday. Aside from that, there hasn’t been much movement in Major Currencies. The GBP gained ground against the EUR, causing the EURGBP currency pair to fall 0.85 percent.
BTCUSD (Bitcoin) declined 3.18 percent as the market anticipates the release of US jobs data today.
Technical Analysis
GBPUSD (4-Hour Chart)
Yesterday, GBPUSD gained ground in the early European session before closing with a gain of only 14.1 pips, or 0.11 percent. GBPUSD is currently trading above the 1.3126 level and is moving pretty flat in anticipation of today’s labor report. Today’s support is around 1.3080, while the resistance is at 1.3188. GBPUSD is trading below its 50-day and 200-day simple moving averages (SMAs) and is hovering around its 100-day SMA on the four-hour chart.
Resistance: 1.3188
Support: 1.3080
EURUSD (4-Hour Chart)
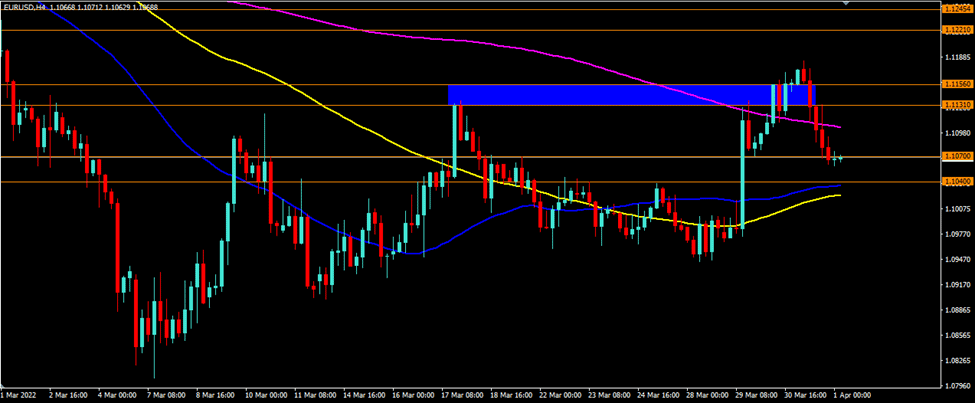
After two days of gains, the EURUSD fell to the previous support level of 1.1070 and subsequently to 1.1040. The resistance levels are 1.1131 and 1.1156. On the four-hour chart, EURUSD is trading above its 50-day and 100-day SMAs but below its 200-day SMA (SMAs).
Resistance: 1.1131. 1.1156
Support: 1.1070, 1.1040
XAUUSD (4-Hour Chart)

The XAUUSD rose somewhat on Thursday, although the market is still waiting for a major move from US jobs data. XAUUSD briefly tested our resistance level of $1948 and is now trading slightly above the $1936 level. Our resistance level is still $1948, with the next one at $1964, and support levels at $1921 and $1910. XAUUSD is now trading below its 100-day simple moving average but above its 50-day and 200-day SMAs on the four-hour chart.
Resistance: $1948, $1964
Support: $1921, $1910