Market Focus
US markets headed to north on Tuesday as major companies continued to report their strong Q3 earnings, easing concerns of persistent pandemic cases and inflations. The Dow Jones Industrial Averages climbed 0.6%; the S&P 500 rose 0.7% whilist the Nasdaq Composite advanced 0.7%. Notably, the S&P 500 is back in the rally mode, sitting less than 1% from its all- time highs, mainly driven by the impact of supply- chain snarls and higher commodity prices.
The world’s largest cryptocurrency, Bitcoin rose back toward record, above $64,000, as first related US ETF debuted on Tuesday. It is the first Bitcoin ETF to trade in the US on a regulated exchange, which comes after many years of the cryptocurrency industry hoping to get one that provides traders to have a safe access to Bitcoin exposure.
The International Monetary Fund has downgraded its 2021 economic outlook for Asia. The outlook is down 1.1%, 6.5% vs. 7.6%, after the highly infectious pandemic cases continues to hurt some regions in Asia. “The global COVID-19 pandemic is still ravaging the region,” said in the report from CNBC.
Main Pairs Movement:
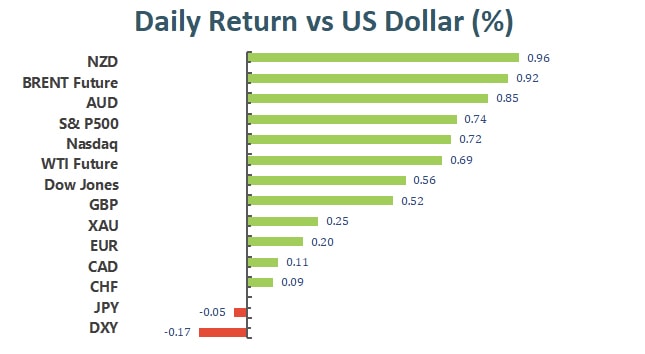
The greenback closed in the red against most of its major rivals on Tuesday, albeit a modest rebound after the Wall Street opening. Macro calendar is boring during the day, making traders to depend on the sentiment for direction. The dollar index dropped nearly 0.23% amid the broader risk-on market mood.
The EUR/USD pair trades around 1.1640, while GBP/USD hovers around the 1.3800 level. The antipodean pairs are the best performers, with AUD/USD surged 80 pips to 0.7475, and NZD/USD soared over 1% to 0.7170. USD/CAD settles around 1.2360, and USD/JPY was last seen at 114.300.
Gold climbed to $1,785 a troy ounce at the European session, but soon fell back after the New York trading hours, ending the day with modest gains at around $1,770.00. Crude oil failed to hit the fresh highs and fell back to the familiar levels. WTI settled at $82.80 a barrel, and Brent at $84.90.
Spotlights are now on the UK inflation data, as the Bank of England has hinted at a possible rate hike as the first move in the case inflation keeps rising above the desired levels.
Technical Analysis:
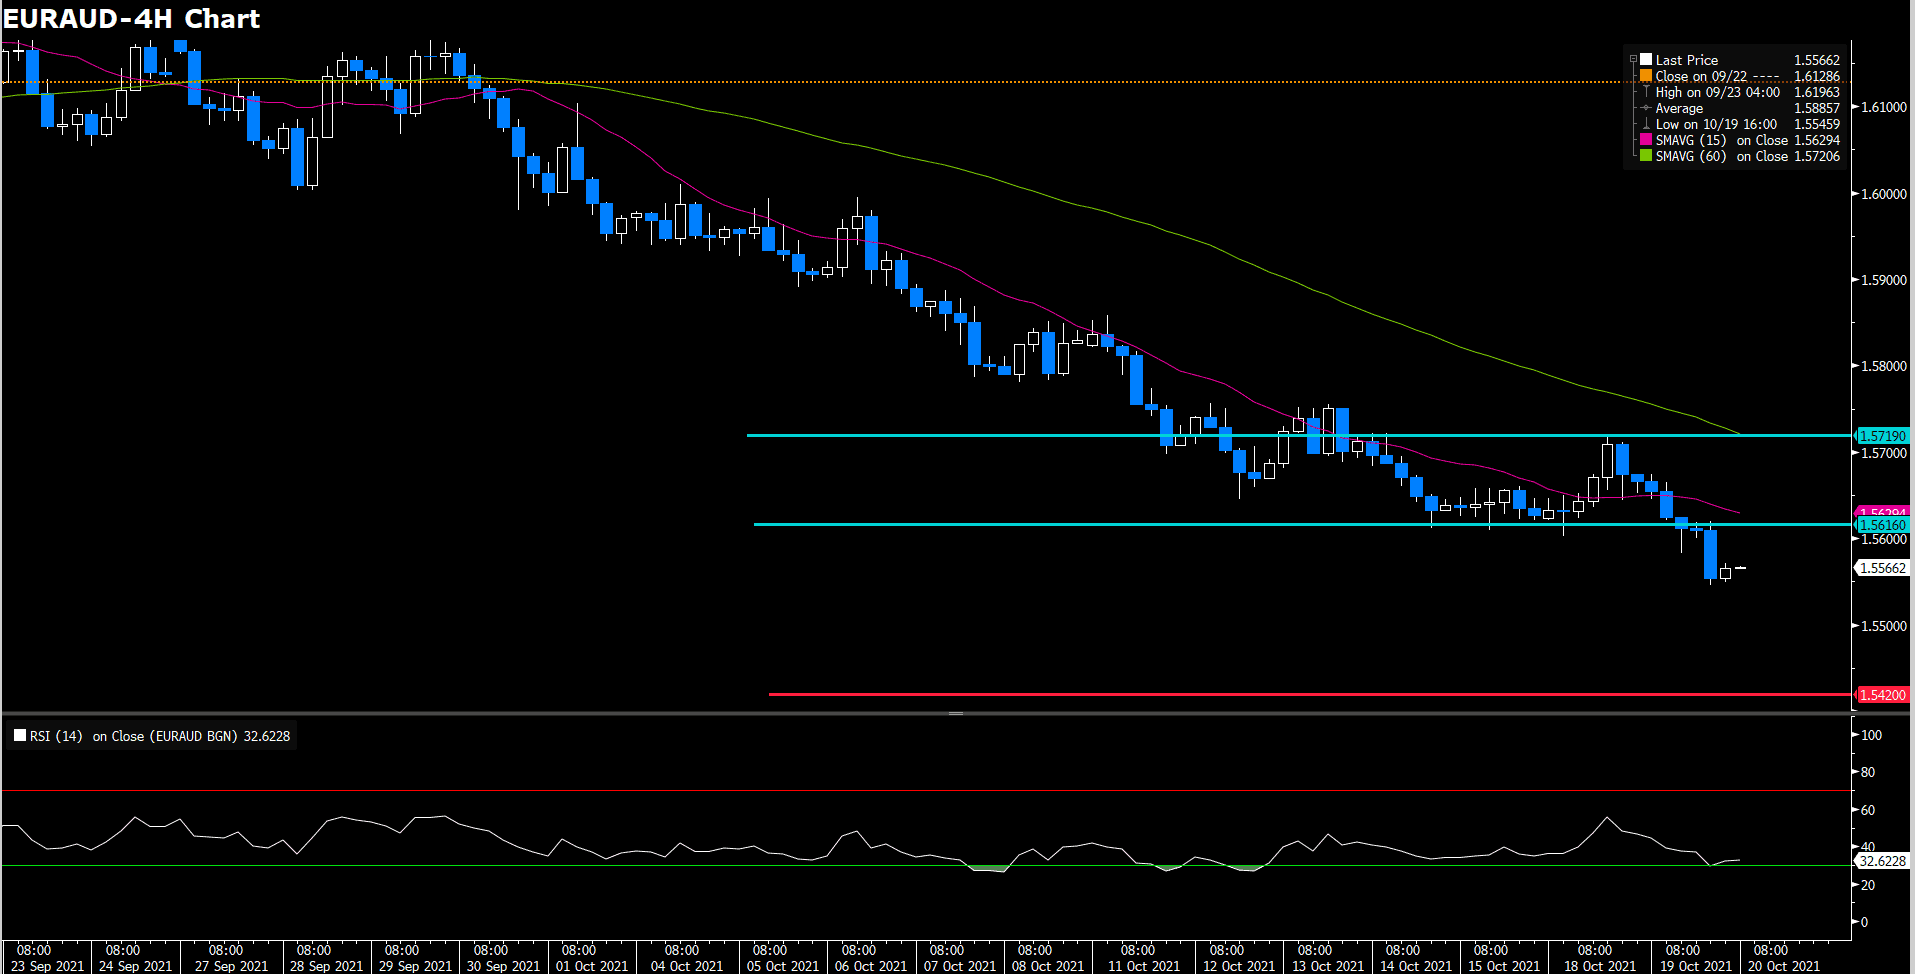
The EUR/AUD cross is plummeting during the New York session, losing over 0.6%, and trading at 1.5550 as of writing. Though the Reserve Bank of Australia (RBA) unveiled their unwillingness to raise rates in the near term, investors seemed to have increased the odds of a 2022 interest rate hike, as the Bank of England and other developed economies see their central banks switching towards a normal monetary policy.
Looking forward, the approach of the French Presidential election next year and the tensions regarding the rule of law between the EU and Poland and Hungary may weigh on the EUR, and the AUD may keep benefitting from the rises of the commodities, both of which could extend the pair further south.
On the technical front, the 4-hour RSI is one step ahead of the oversold territory, and the price actions have already breached the bottom of the Bollinger band, suggesting a short-term correction may come before further decline.
Resistance: 1.5616, 1.5719
Support: 1.542, 1.525

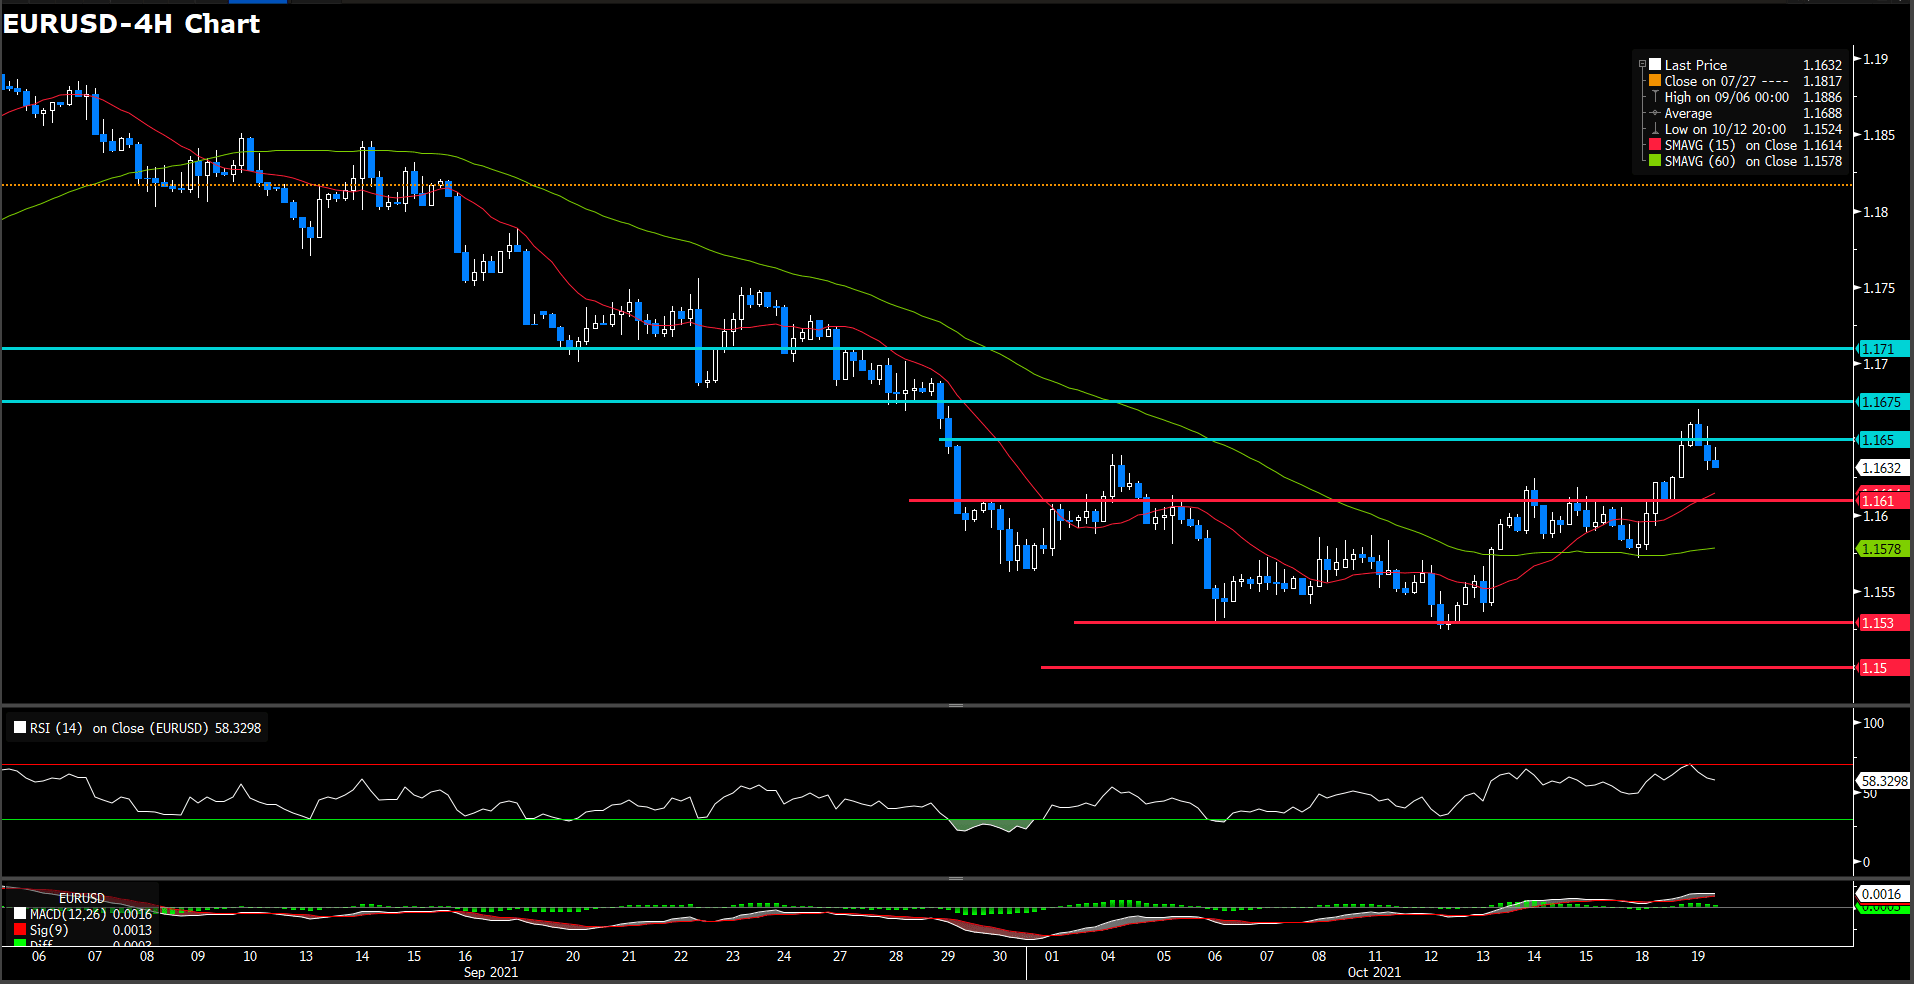
The euro has extended it recovery on Tuesday, fueled by a positive market mood, to reach the upper range of 1.1600 for the first time since late September. The pair has pulled back afterwards, to consolidated well above 1.16, putting some distance from the 15-month low hit last week, at 1.152 area. Meanwhile, euro gains capped by dovish ECB’s Lane. On the macroeconomic front, U.S. building activity has shown a contraction in Sept, demonstrating that shortages in raw materials and labour are starting to squeeze the construction market that may have negative impact on third quarter’s economic growth.
On technical side, the RSI solely moved whereabout 58.7 figures, a slightly changed compare yesterday, suggesting a slightly bullish movement in short term. On moving average aspect, 15- long indicator has expedited it up side traction and 60-long indicator is turning it head to slightly upward momentum.
In lights of current price has penetrated 1.161 level which we expected as a critical resistance for up traction before, it seems could continue the bullish movement if it could hold above the threshold. On up side, we expect the immediately resistance will be psychological level at 1.165 and 1.1675 following
Resistance: 1.165, 1.1675, 1.171
USDJPY (4 Hour Chart)
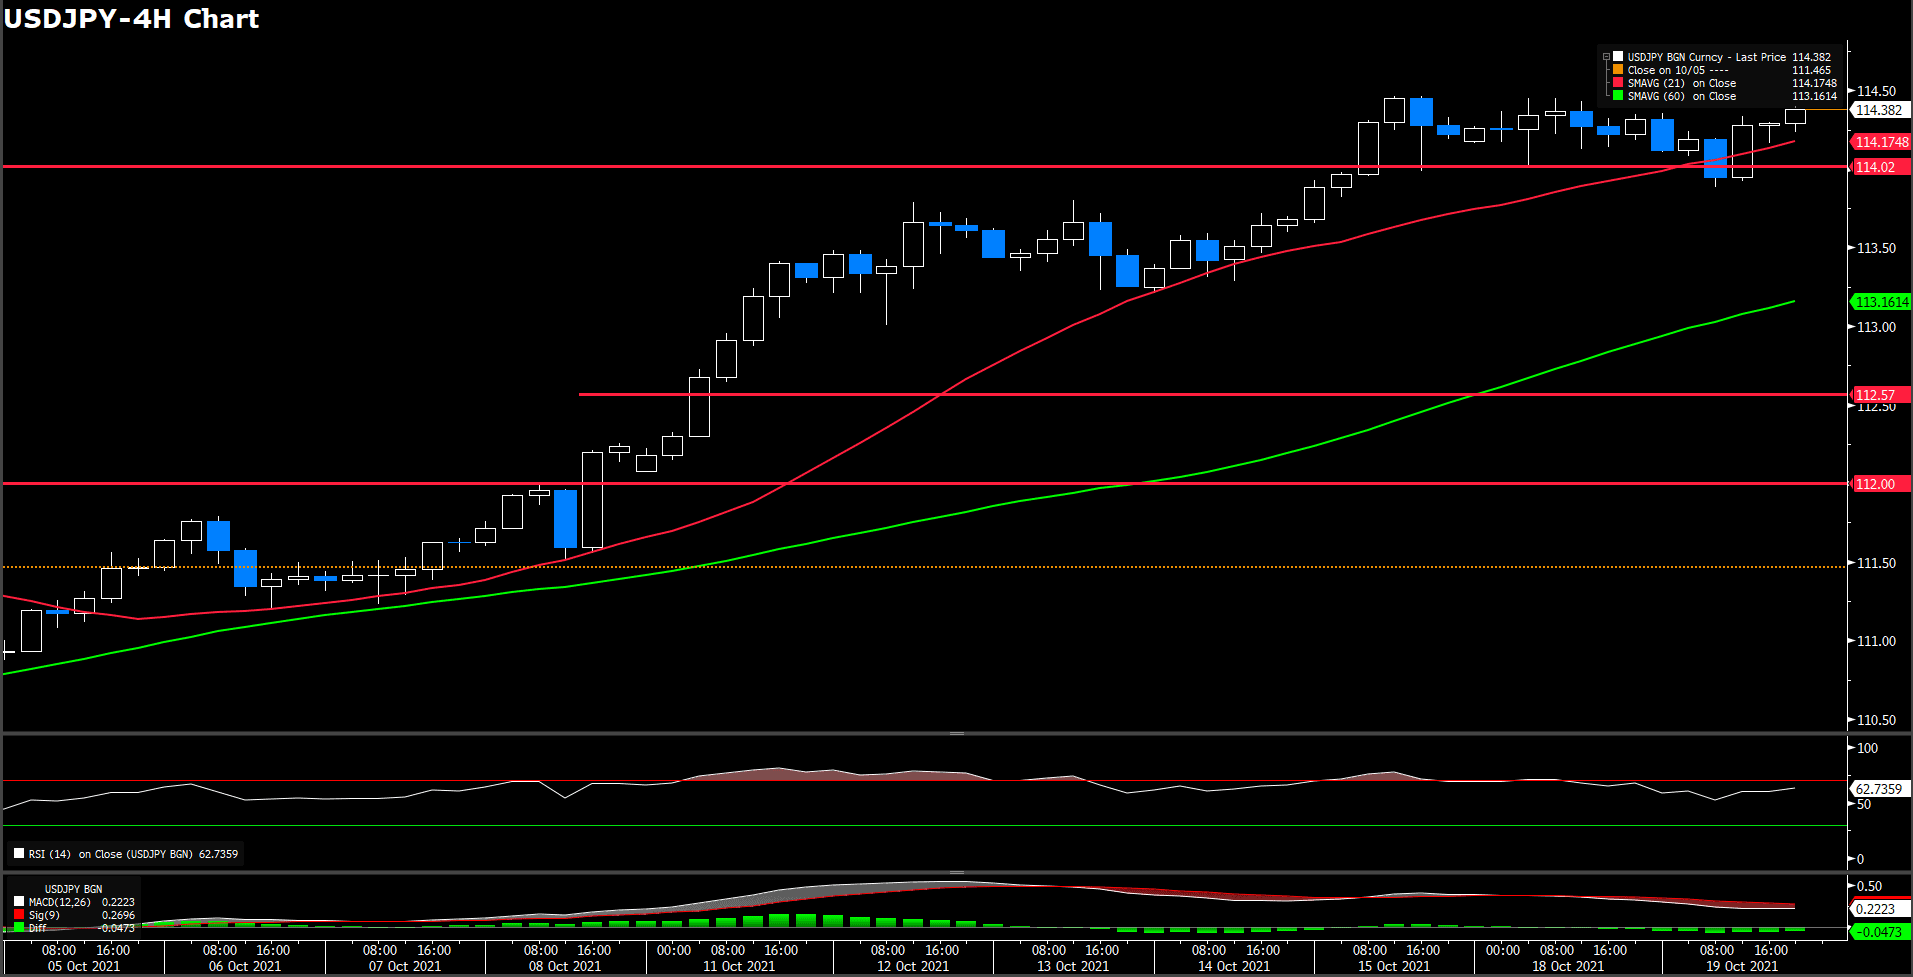
The Japan yen retreated from the three-year high at 114.45 hit on Monday, to session lows at 113.85 before bouncing up and returning to the 114.3 area. The yen’s rebound, however, has been short-lived. The yen particularly sensitive to monetary policy differentials, remains heavy while the market positions for an imminent announcement that the Fed starts to taper its massive stimulus programs. These expectations have been widening the treasury yield gap between the U.S. and Japan whose central bank maintains the 10-year note near zero through a yield control curve which is crushing investor’s appeal for the yen.
From a technical perspective, RSI indicator rebound reversed from over bought sentiment at 62.8, suggesting bullsish momentum in short term. On moving average indicator, 15- and 60-long indicator still retaining upside traction.
Since yen stand above 114 level solidly for days, it seems lost driving momentum or further trigger foundamental news currently. Therefore, 114 level still a important support level for buy side investor.
Support: 114.02, 112.57, 112
Economic Data
|
Currency |
Data |
Time (GMT + 8) |
Forecast |
||||
|
CNY |
PBoC Loan Prime Rate |
09:30 |
– |
||||
|
GBP |
CPI (YoY)(Sep) |
14:00 |
– |
||||
|
EUR |
CPI (YoY)(Sep) |
17:00 |
3.4% |
||||
|
CAD |
Core CPI (MoM)(Sep) |
20:30 |
– |
||||
|
OIL |
Crude Oil Inventories |
22:30 |
1.857 M |
||||


