Daily Market Analysis
Market Focus
US markets traded higher following the release of consumer prices index. Consumer prices increased slightly more than expected in September. The rises of food and energy prices offset the declines of used vehicles prices, according to the Labor Department.
US social security cost- of- living adjustment will be adjusted 5.9% higher in 2022, according to Social Security Administration announced. Notably, the adjustment will be the biggest boost in about 40 years. Comparing to 2021, the Social Security cost- of- living was only 1.3%.

After the release of CPI, the US Federal Reserve officials broadly agreed on the plan, tapering process by mid- November. The tapering process could see a monthly reduction of $10 billion in Treasury and $5 billion in mortage- backed securities.
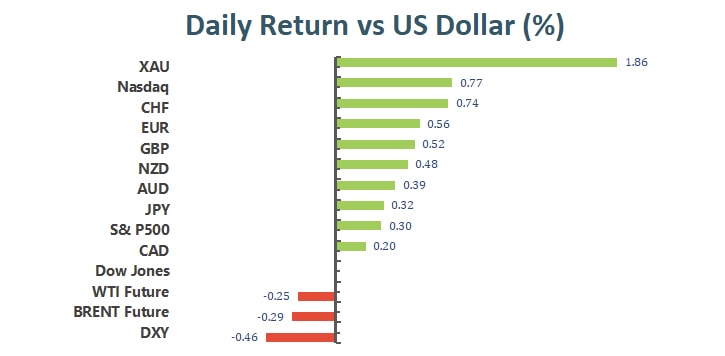
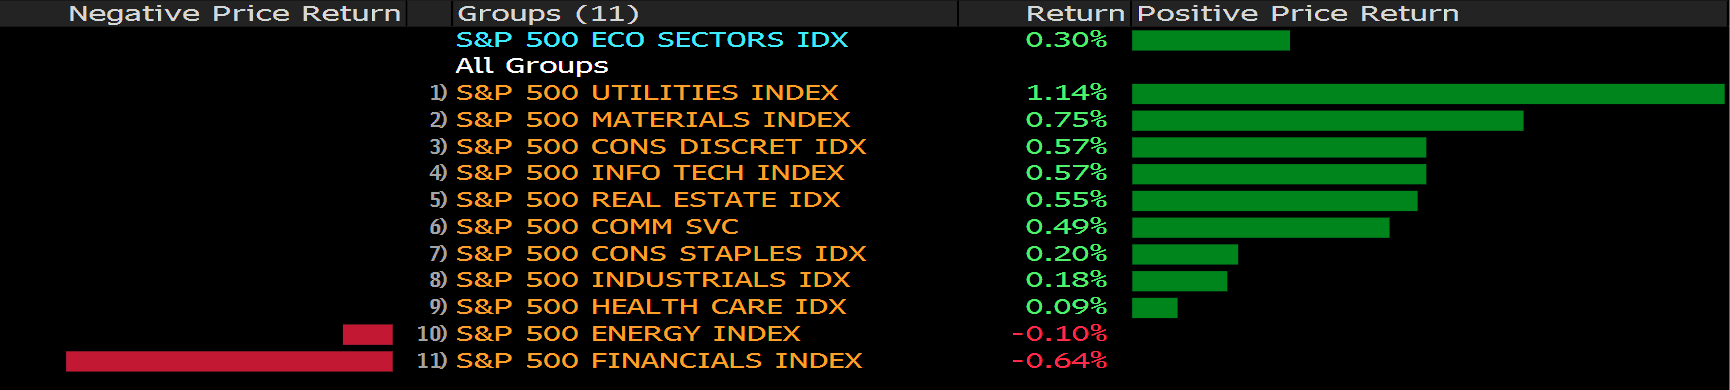
Main Pairs Movement:
The precious metal, gold rose to the highest in almost a month as the US Treasury yields and the US dollar declined after the release of CPI, slightly higher than the expectation. Gold price traded at $1,793, up nearly 2% on Wednesday. The upsurge of gold price could be potentially seen as the initial reaction to the inflation.
GBPUSD traded further north, trading 0.52% higher. Lower US Treasury yields undermined the demand for the greenback; however, the upside momentum of the British pound was still limited as the Brexit led- woes, weaker GDP, and worker shortage continued to be issues.
EURUSD traded similarly to GBPUSD amid the concern of US inflation and lower US Treasury yields. In the end of the day, the currency pair closed at 1.15907, 0.53% higher.
Technical Analysis:
EURUSD (4-hour Chart)

The EUR/USD pair trades at the intraday high 1.1596 as of writing. However, the current recovery could well be seen as corrective, as the pair remains below a firmly bearish 20 DMA. The MACD histogram remains flat within the negative territory, while the RSI indicator has bounced from oversold readings, yet holding below 50.
As expected, the Fed reaffirmed their previous statements in the latest FOMC Minutes: to start tapering in either Novenber or December, and to end it in mid-2022. The dull announcement did little to the market.
As to the resistence and support levels, our opinion remains unchanged. The first support appears at the 1.15 psychological level, then 1.14225, the 2020 May’s top; the resistence levels are at 1.161, 1.166 and 1.171, where the historical tops and bottoms lies. The 20 DMA is also a strong resisitence to the pair, as a breach of it marks a flip of the market sentiments.
Resistance: 1.1610, 1.1660, 1.1675,1.1710
Support: 1.153, 1.15, 1.14225

The price of gold on Wednesday has rallied as key data today, U.S. inflation data showed prices rose solidly in Sep, stoking expectations the Federal Reserve will announce a tapering of stimulus next month, with the potential for rate hikes by mid-2022. The Consumer Price index rose 0.4% last month, versus a 0.3% rise expected by economists. At the time of writing, gold is trading at 1791.99. The price has travelled from a low of 1757 to a high of 1796 where tests the 200-day EMA.
On the technical front, the 4-hour RSI index has breached the over bought territory at 72.83 figures, suggesting a overly bullish sentiment at short term. On moving average side, 15- and 60-long indicator are both heading to upside traction.
As gold penetrate 1780 psychological resistance level in New York Session, we expect market has found an accommodative bullish territory ahead while Fed boosting the tapering expectation, price action told as well. On upside, we foresee 1800 will give upside traction a barricade, far way 1830 follow.
Resistance: 1800, 1830
Support: 1783, 1758, 1750