Daily Market Analysis
Market Focus
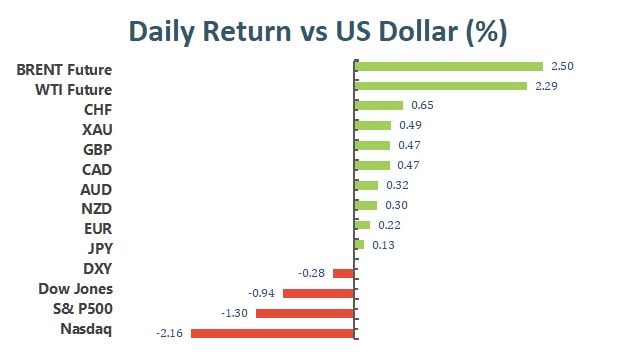
The broad U.S. equity markets experienced a sell off on the first trading day of the week. The S&P 500 dropped 56.58 points to close at 4300.46, while the tech-heavy Nasdaq lost 2.1% and the Dow closed 0.9% down. Market sentiment was affected by the rising yield curve and soaring commodity prices.
Since the Federal Reserve meeting last week, the 10-year Treasury yield has jumped to around the 1.5% region. Rising bond yields are motivated by the increasingly hawkish stance that global central banks are presenting. The imminent bond tapering and possible interest rate hike has especially affected “big tech” firms. As the S&P info-tech index suffered a more than 2% drop.
OPEC+ failed to come to an agreement on raising production restriction, instead the group would stick to the previously agreed upon plan of lifting collective output by 400,000 barrels per day. Affected by the news, the WTI rose 2.3% to close at 77.62 dollars a barrel, while the Brent Crude jumped 2.5% to close at 81.26 dollars a barrel, its highest settling price in three years.
Market participants will now shift their attention to the ADP Nonfarm payroll and the U.S. initial jobless claim figures, both important gauges on economic recovery, which will be released on Wednesday and Thurday of this week, respectively.
Main Pairs Movement:
The US dollar shed some ground on Monday, but no critical level was affected. Greenback losses were limited as the market’s mood was sour, with the focus on Evergrande and China’s financial stability.
The single currency was among the worst performers against the US dollar. EUR/USD pair currently trades around 1.1620, after meeting sellers in the 1.1640 price zone. Cable regained the 1.3600 level, despite some tensions related to Brexit and fuel shortages.
The USD/JPY pair edged lower amid the poor performance of equities and lower government bond yields. The US 10-year Treasury note yield dropped below 1.50% after a breaking attempt at the start of the day. CHF appreciated sharply in a risk-off sentiment. USD/CHF settled at 0.9245. Australia has a packed macroeconomic calendar, which includes the RBA monetary policy decision.
Global indexes closed in the red, as investors eyed news coming from China. Evergrande, the troubled property giant, requested a trading halt over the announcement of a major transaction. The news suggested the company will sell a majority stake in its property management business for more than US$5 billion, a sign that the company is still working on covering its US$305 billion debt.
Technical Analysis:
GBPUSD (4 Hour Chart)
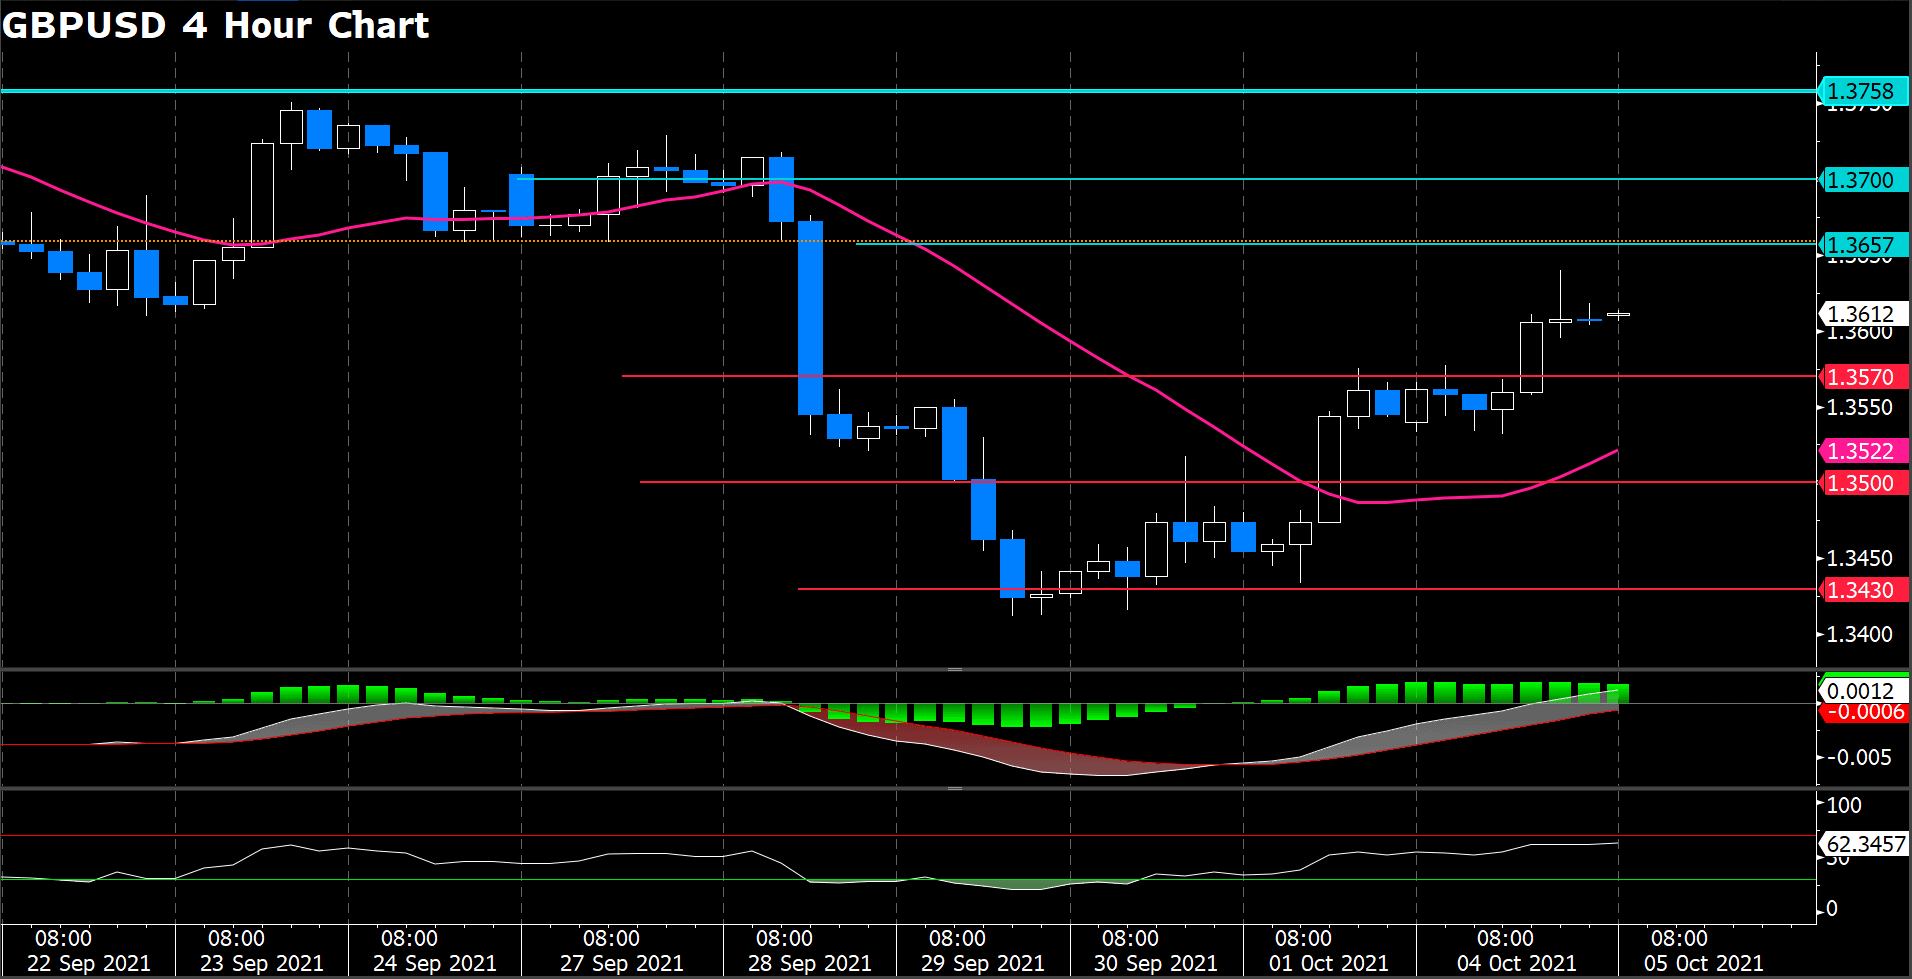
The British pound push above 1.3600 could open the door for further gains, but a daily close above the latter is required. In case of that outcome, the first resistance level would be the September 24 low at 1.3657. A breach of that level could push the pair towards key supply levels like the figure at 1.3700 and the 50-day moving average at 1.3758.
On the flip side, failure at 1.3600 would exert additional downward pressure on cable. The first demand zone would be the July 20 low at 1.3571. A break of that level would expose 1.3500, followed by the October first low at 1.3433.
The RSI indicator is at 45, and the MACD histogram is negative. Though remaining bearish both of them are with upside slopes, suggesting the sentiment is recovering.
Resistance: 1.3657, 1.3700, 1.3758
Support: 1.3571, 1.3500, 1.3433
EURUSD (4 Hour Chart)
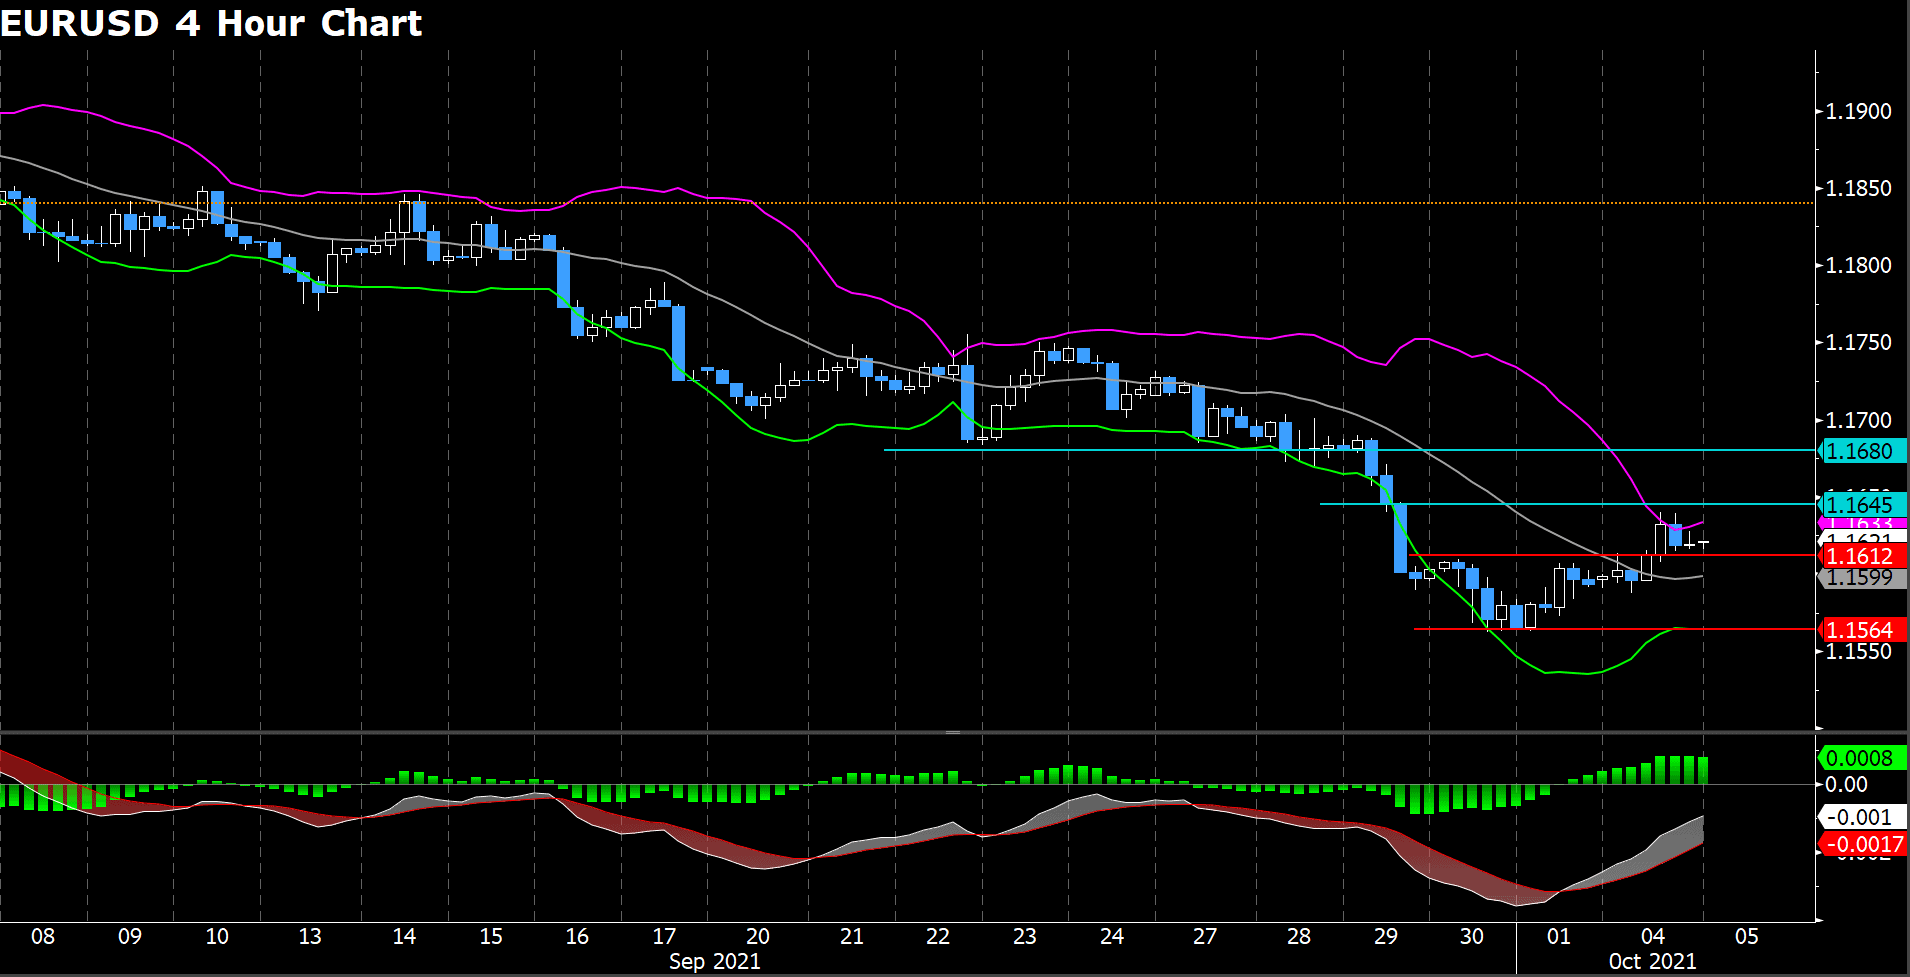
The euro fiber pair surged up for a second consecutive day, but the advance seems lack of powerful momentum then mere correction after U.S. session, currently trading at 1.162 which after meeting seller in 1.1645 level. At the meantime, global shares indexes closed in the the red, as investors eyed news coming from China which giving support for safe-haven sentiment.
From a technical perspective, EUR/USD is trading at the edge of upper bounds of the bollinger bands that driving a downside movement. Meanwhile, RSI index has pull back from the over sought territory to neutral area at 49.7 as of writing, suggesting market is adsence the sence of market direction.
For sideway, we expect the first barricade ahead of is 1.1645, following a strong resistance at 1.168.
Resistance: 1.1645, 1.168
Support: 1.1612, 1.1564
USDCAD (4 Hour Chart)
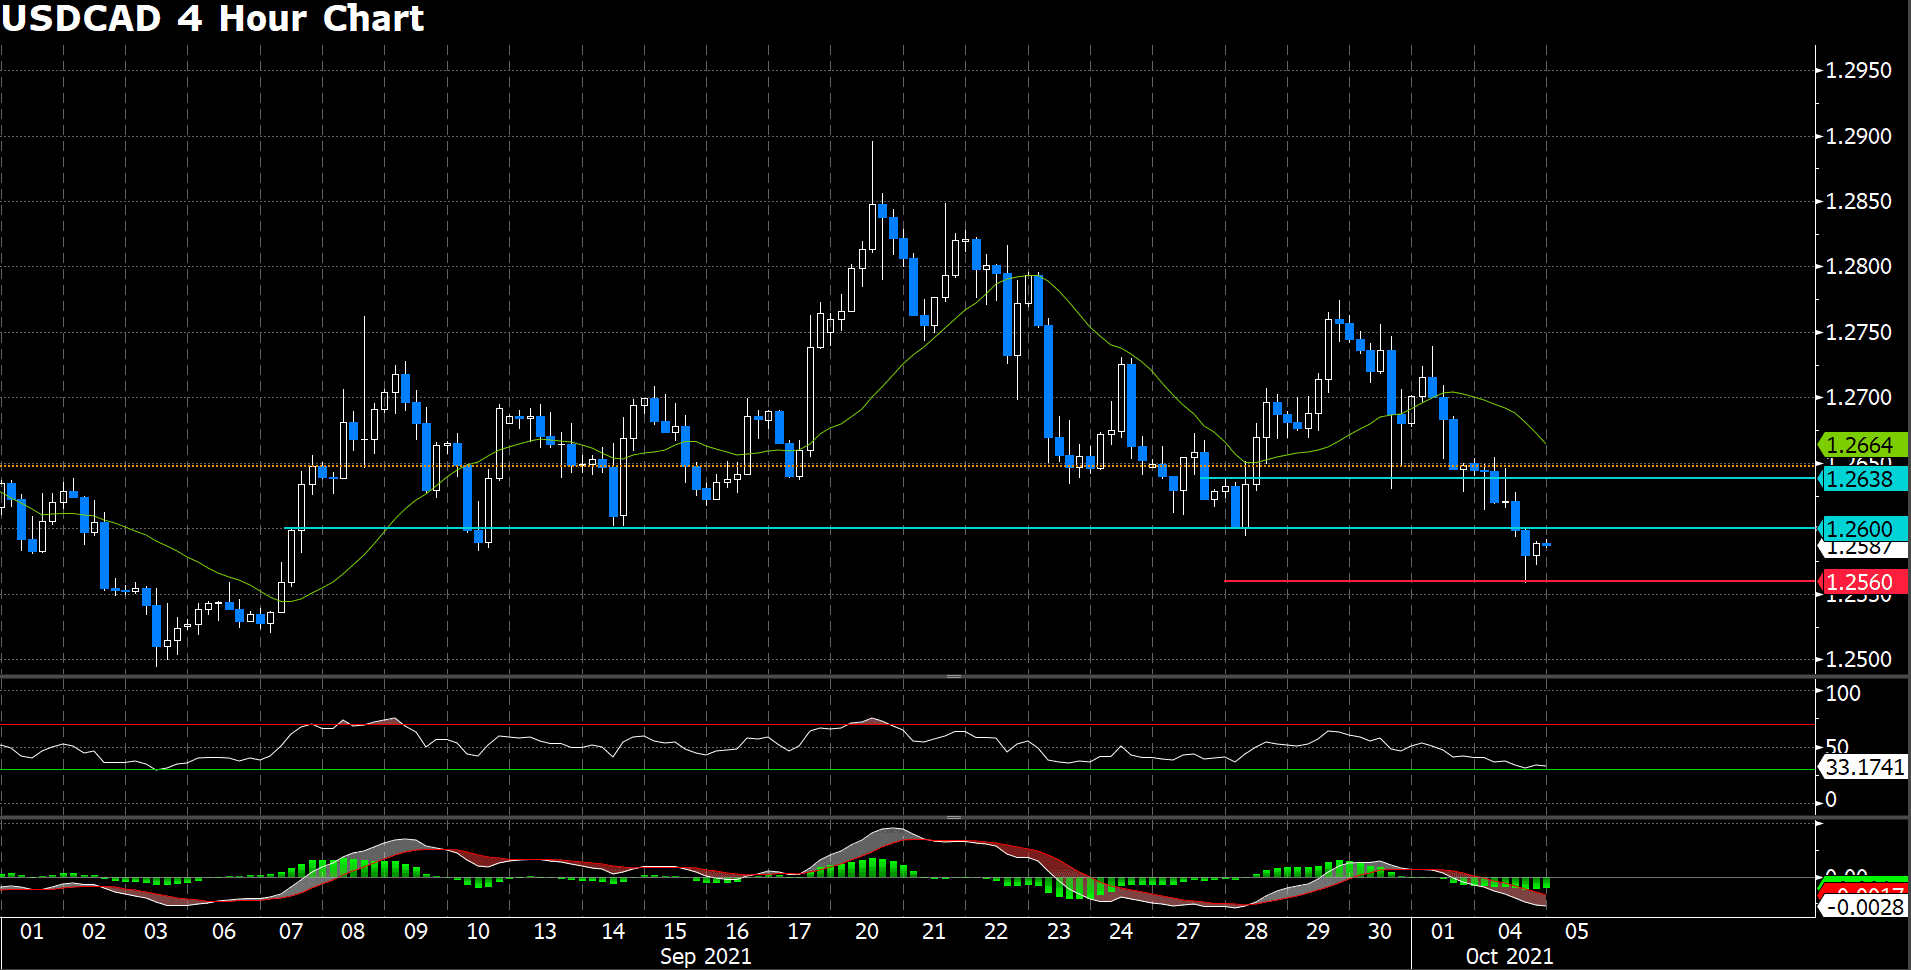
Loonie has weakened during the last weeks despites surging energy prices. According to National Bank of Canada analysys, the correlation is unusual, and they see that energy prices should decline further or the loonie strengthen. The pair has extended the reversal from last week’s peak, at 1.2587 as of writing, to hit intraday lows at 1.2555 area so far.
From a technical perspective, RSI index show 33 figure that close to over sought area which suggest a bearish market movement at the moment. On the other hands, MACD shows another downside guidance where figure successive print negative figure as of writing.
For the slip way, it seem doesn’t have to much downside support level where last support at 1.256.
Resistance: 1.26, 1.2638
Support: 1.256
Economic Data
|
Currency |
Data |
Time (GMT + 8) |
Forecast |
||||
|
AUD |
Retail Sales (MoM) |
08:30 |
– |
||||
|
AUD |
RBA Interest Rate Decision (Oct) |
11:30 |
0.1% |
||||
|
AUD |
RBA Rate Statement |
11:30 |
– |
||||
|
GBP |
Composite PMI (Sep) |
16:30 |
54.1 |
||||
|
GBP |
Services PMI (Sep) |
16:30 |
54.6 |
||||
|
USD |
ISM Non-Manufacturing PMI (Sep) |
22:00 |
60 |
||||
|
EUR |
ECB President Lagarde Speaks |
23:00 |
– |
||||


