Daily Position Report
PNL Changed (System Time 8/11 00:00– 8/11 23:50) Total PNL During the Day
Clients’ Gains were 1.317m ten minutes ahead of EOD.
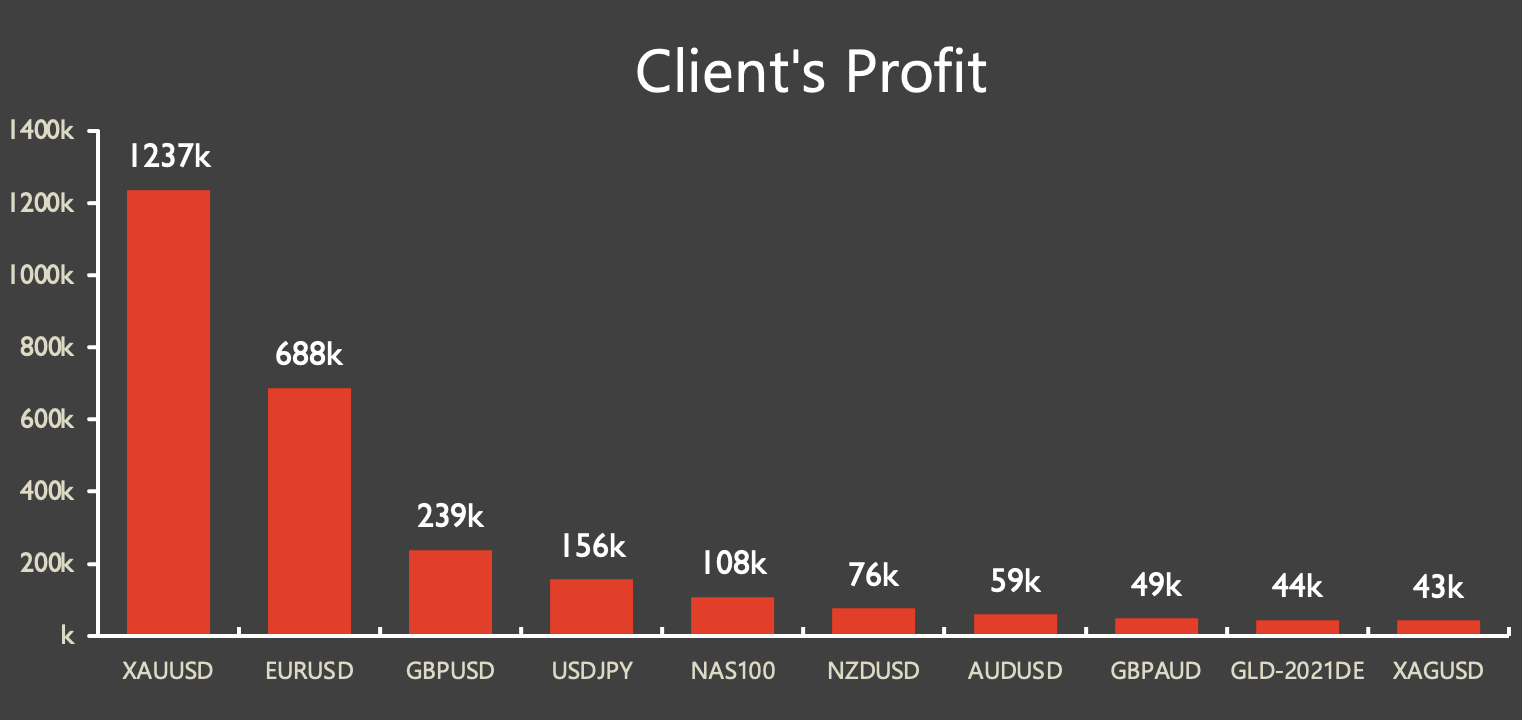
Clients Profit
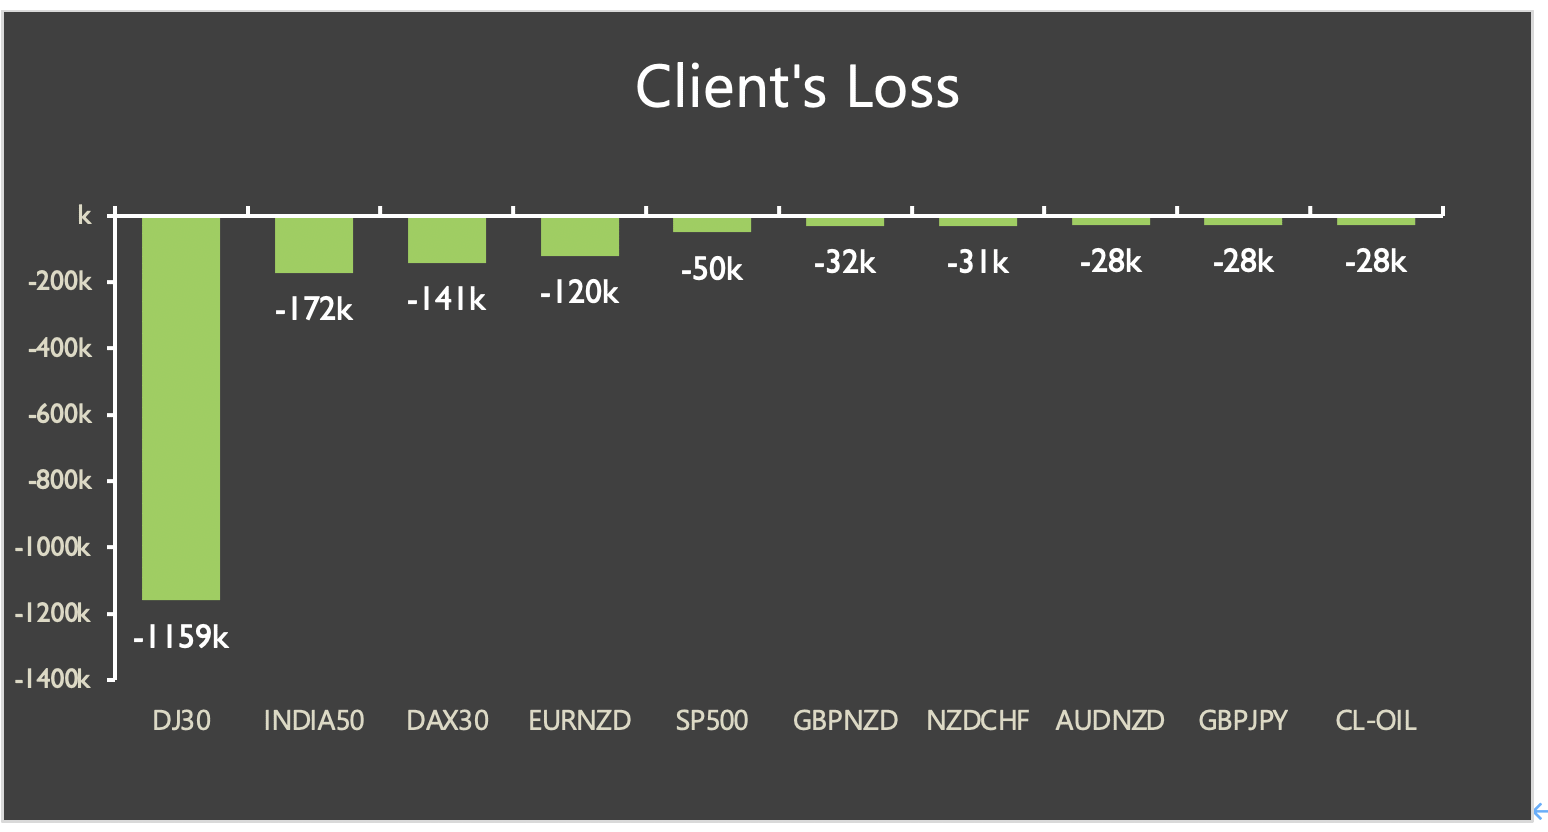
Clients Loss
Client Net Position
BOOK Exposure & Top PNL at EOD
Market Focus
US markets were mixed after the inflation report was not as bad as feared. The Dow Jones jumped 220.3 points, a new record high. The S&P 500 edged higher to 444.70 while the Nasdaq 100 closed with 0.1% lower. The consumer prices jumped 5.4% in July; however, the core inflation, which excluded energy and food, rose by 0.3% last month, less than the expectation of 0.4%.
According to Dallas Federal Reserve President Robert Kaplan, the central band should start tapering its monthly purchases of bonds in October. As the economy and employment become more healthier, the fed should be comfortable pulling back on the stimulus.
US President Joe Biden has pledged to wean off the fossil fuels and has called been more urgent. At the same time, Joe Biden’s administration has called Saudi Arabia and its allies to produce and unleash more crude oil onto global markets.
Main Pairs Movement:
Crude oil future edged higher on Wednesday after Joe Biden’s administration mentioned that it would not call on US crude oil producer to increase oil output. In the meantime, the administration indicated that the output from OPEC+ is not enough, might potentially harming global recovery. As a result, the crude oil price closed at 69.25, up 1.41% on Wednesday.
The Aussie closed higher at 0.73745 amid the concerns of the US inflation report and the resurgence of new variant delta cases. However, the currency pair seems to consolidate in a tight range as the decline of iron- ore prices and the protracted NSW lockdown, according to National Australia Bank.
The precious metal, gold, rose the most in three months as the dollar declined after the US inflation report, easing fears that the Fed might soon pull back stimulus. Gold edged as much as 1.5%, as closed in $1751 on Wednesday.
Technical Analysis:
GBPUSD (4-hour Chart)
Sterling caught some aggressive bids during the early New York session and shot to fresh daily tops, around the 1.3870-75 region in reaction to mixed U.S. inflation data. The headline CPI decelerate to 0.5% gains in July from the 0.9% increase recorded in the previous month. Additionally, core CPI, which excludes food and energy prices, rose 0.3% MoM against 0.4% expected and June’s 0.9%. This, along with Fed president comments, weghed on the dollar. For technical aspect, RSI indicator rebound to 51 figure, suggesting neutral momentum. For moving average side, 15 long SMA indicator turn static movement and 60 long SMA seems slightly downward.
In lights of aforementional, we still expect this pair will continue slightly move to sideway. If price fall ahead, the first immediately support level will eyes on 1.385 level in short term and 1.38 level follow. If price could go over the last highs spot which around 1.395, it will heading to over 1.4 level.
Resistance: 1.3896, 1.395, 1.4
EURUSD (4- Hour Chart)
EUR/USD pair recovered from a fresh low at 1.1705, yet the recoverystaled around 1.175 threshold, maintaining the tepid tone at 1.17368 as of writing. On Thursday, June industrial production data will be featured in the European economic docket. Later in the day, the weekly initial jobless claims and producer price index data from the U.S. will be looked upon for fresh impetus. From the technical perspective, RSI indicator recovered from over sought territory and printed 44 figures, suggesting slightly bearish momentum. For moving average side, 15 and 60 long SMA indicator are both heading to negative side.
As our mention previously, we expected if price drop below 1.1755, market momentum would drag it to lower lows that eyes on 1.17. In the day market, we see euro fiber was blocked by critical upper resistance at 1.1755 then turn it head back down slightly. All in all, we expect 1.17 will be the final support level for bid buyer. If break through the 1.17 level, then price will ahead to lower stage.
Resistance: 1.1755, 1.18, 1.185
Support: 1.17
XAUUSD (4- Hour Chart)
Gold clings to strong recovery gains on Wednesday as renewed dollar weakness helped it gain traction in American session, after released CPI data. As of writing, gold was up 1.4% on the day at $1753. The U.S. dollar index is currently down 0.2% on a daily basis at 92.88. At the same time, benchmark 10 years U.S. Treasury bond yields is down 2%. For technical side, RSI indicator record 48.5 figures as of writing, suggesting slightly bearish movement but lack of direction. For moving average perspective, 15 long SMA indicator toward it slope to upside momentum and 60 long SMA indicator shows south way momentum.
In light of price action, we see market literally rebound from rock bottom days ago to current stage as market revival from overly sell side sentiment. If momentum continue toward to downside, the first critical will on 1730. On up way, we expect 1751 will be strong resistance.
Resistance: 1751.5, 1792, 1830
Support: 1730, 1700, 1682
Economic Data
|
Currency |
Data |
Time (GMT + 8) |
Forecast |
||||
|
GBP |
GDP (YoY)(Q2) |
14:00 |
22.1% |
||||
|
GBP |
GDP (QoQ)(Q2) |
14:00 |
4.8% |
||||
|
GBP |
Manufacturing Production (MoM)(Jun) |
14:00 |
0.4% |
||||
|
USD |
Initial Jobless Claims |
20:30 |
375 K |
||||
|
USD |
PPI (MoM)(Jul) |
20:30 |
0.6% |
||||


