Daily Market Analysis
Market Focus
Stocks halted a three-day slide, with investors migrating to value from growth companies as signs of a strengthening labor market tempered inflation worries.
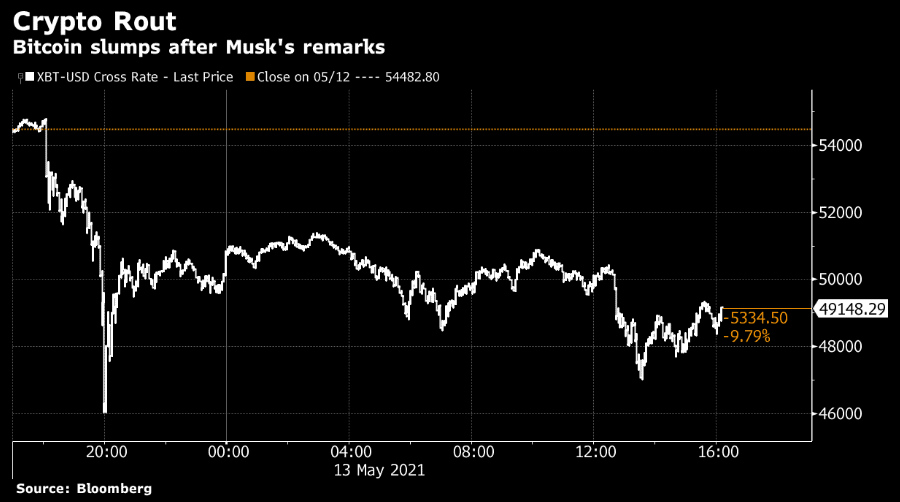
Industrial and financial shares led gains in the S&P 500, while energy producers joined a slump in oil. The tech-heavy Nasdaq 100 underperformed major equity benchmarks as Tesla Inc. slipped after Chief Executive Officer Elon Musk said the electric-car maker is suspending purchases using Bitcoin. In late trading, Coinbase Global Inc. sank as the biggest U.S. cryptocurrency exchange reported revenue below Wall Street estimates.
Confidence on an economic revival that’s reigned supreme amid continued Federal Reserve stimulus has been recently jolted. Data Thursday showed producer prices rose by more than forecast in April, and jobless claims fell. While some investors insist the surge in inflation is a one-off reopening burst, the broader markets are hedging against the possibility it may persist and force the central bank to take action.
Officials have been trying to drive home the message that they see inflation spikes this year as transitory, in contrast with heightened Wall Street concern about runaway prices. Increases above the central bank’s 2% goal should be temporary, but may last through 2022, said Fed Governor Christopher Waller.
The Fed tweaked its plans for buying Treasuries, keeping the monthly pace at about $80 billion but focusing more attention on securities maturing in seven years or longer.
Main Pairs Movement:
A gauge of the dollar’s strength stalled Thursday on the back of the biggest rally in two weeks, with traders weighing signs of a reopening economy against risk that higher inflation may persist. U.S. 10-year Treasury yields slid and the benchmark S&P 500 rose. 10-year Treasury yields slid to 1.67% as commodity prices eased.
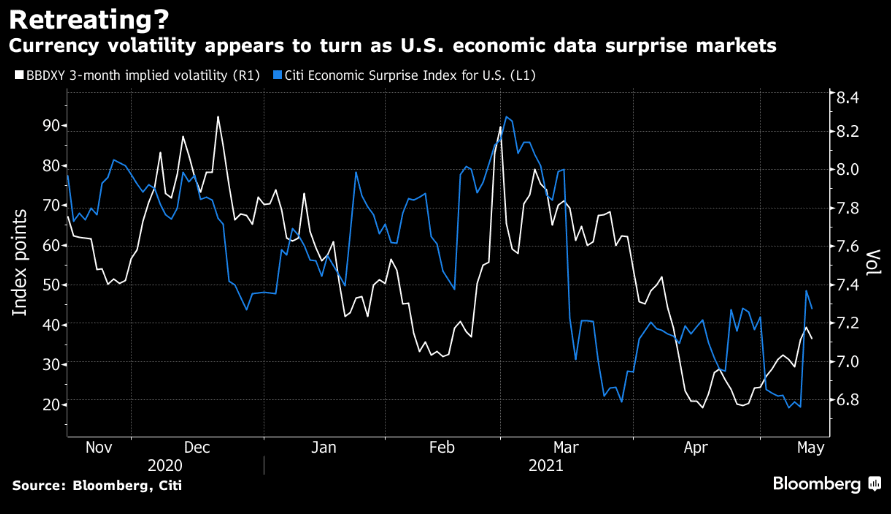
Still, an index measuring the three-month implied volatility of the Bloomberg Dollar Spot Index retreated after reaching the highest since April; the Bloomberg Commodity Index fell.
Traditional haven currencies such as the Swiss franc and Japanese yen advanced as commodity-linked peers, such as the Canadian and Australian dollars slipped versus the dollar. USD/JPY slid 0.2% to 109.50; Pair may be supported by a substantial amount of short-dated forward hedging at the 109.58 spot equivalent level, DTCC data shows. AUD/USD rose as much as 0.4% to 0.7746, erasing an earlier loss.
The New Zealand dollar was among the day’s top-performing Group of 10 currencies amid better risk tone, though nearly NZD1.3b of 0.7260/70 strikes expiring May 18 may slow climb. NZD/USD jumped 0.3% to 0.7180 after earlier rising 0.5%, the most since May 7.
Technical Analysis:
USDJPY (4 hour Chart)
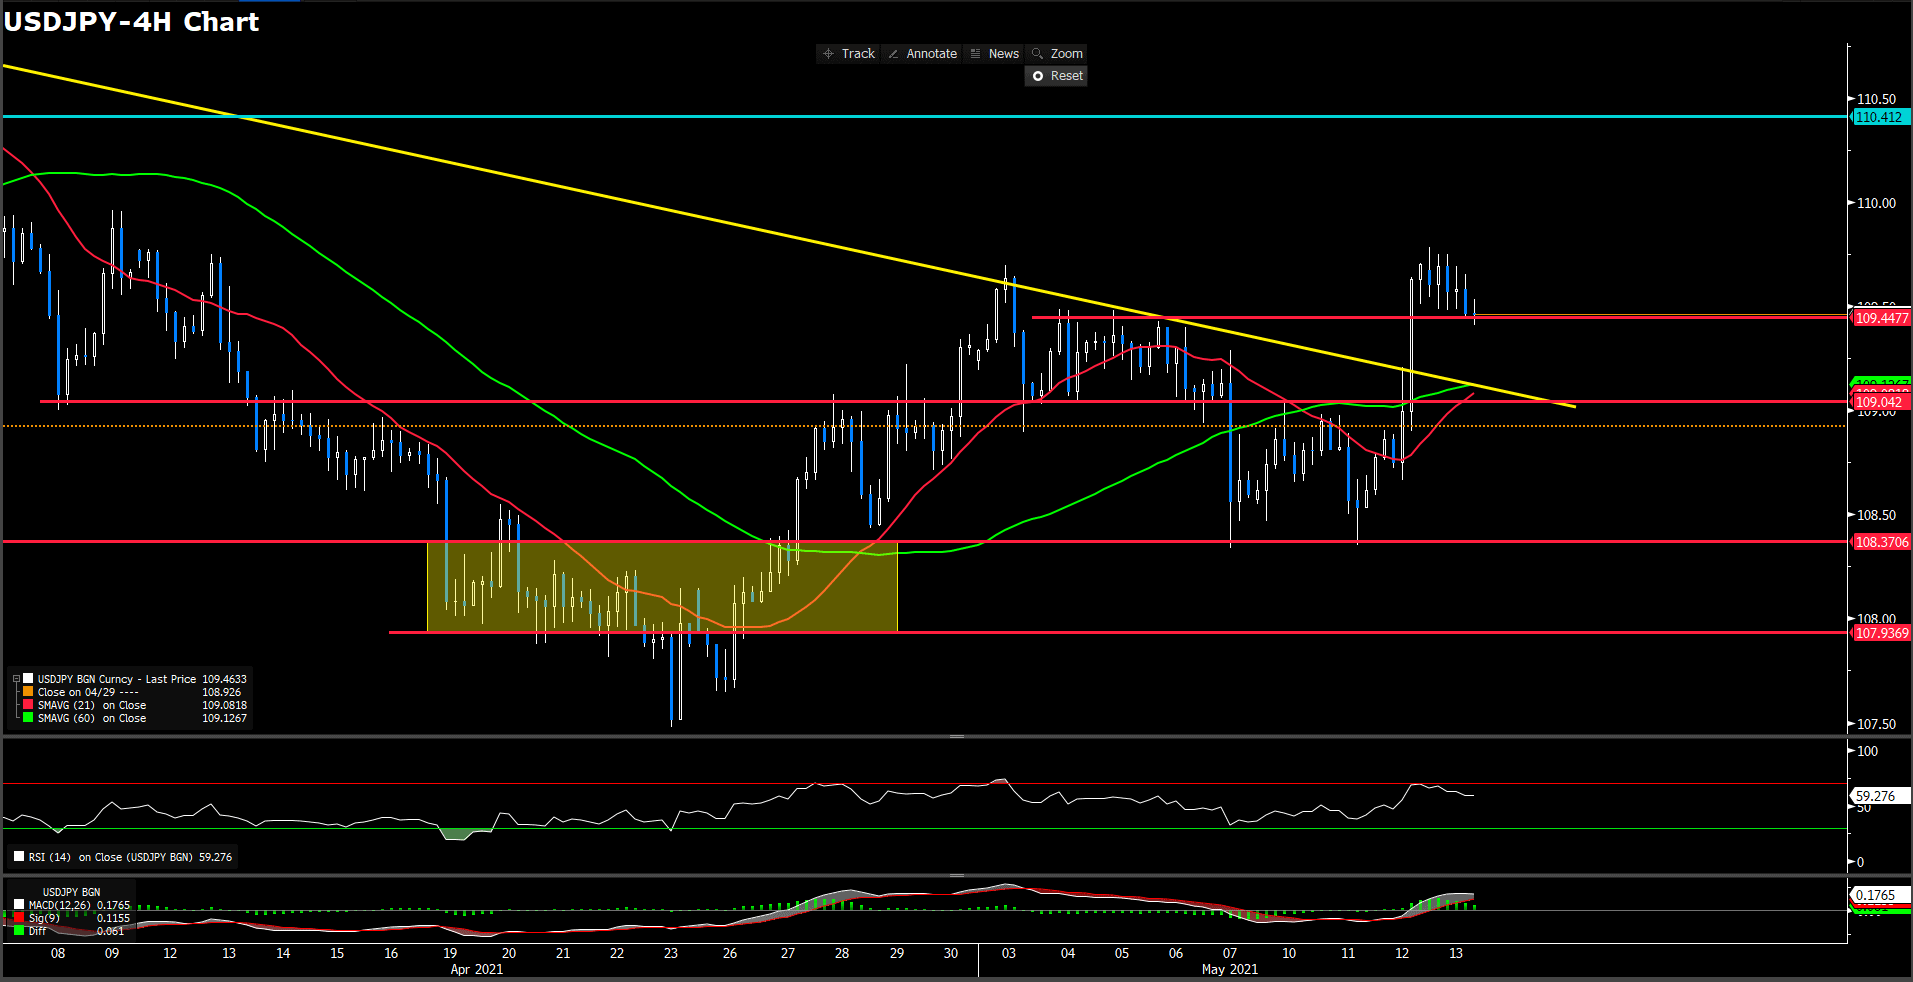
Japan yen remains struggling in in tiny way with consolidative movement throughout the day market, losses -0.14% while trading at 109.449 as of writing. Meantime, U.S. shares market comvalesced from yesterday bleak as initial jobless claim data beat expectation led greenback enact risk-on sentiment intraday. For technical aspect, RSI indicator shows 59 figures, which suggest a bullish momentum sentiment. On average price view, 15-long SMA indicator is ongoing upper slope in day market and 60-long SMA turned slightly upside slope.
According to price action, it seem yen built a comfort short term support in 109.45 arounn which is lowest point in the day. For long term views, we believe yen will go along with indicators momentum, namely, ratch up to higher floor. Therefore, the first immediately is on 109.45 and the critical support level will be 109.042.
Resistance: 110
Support: 109.45, 109.042, 108.37, 107.937
GBPUSD (4 Hour Chart)
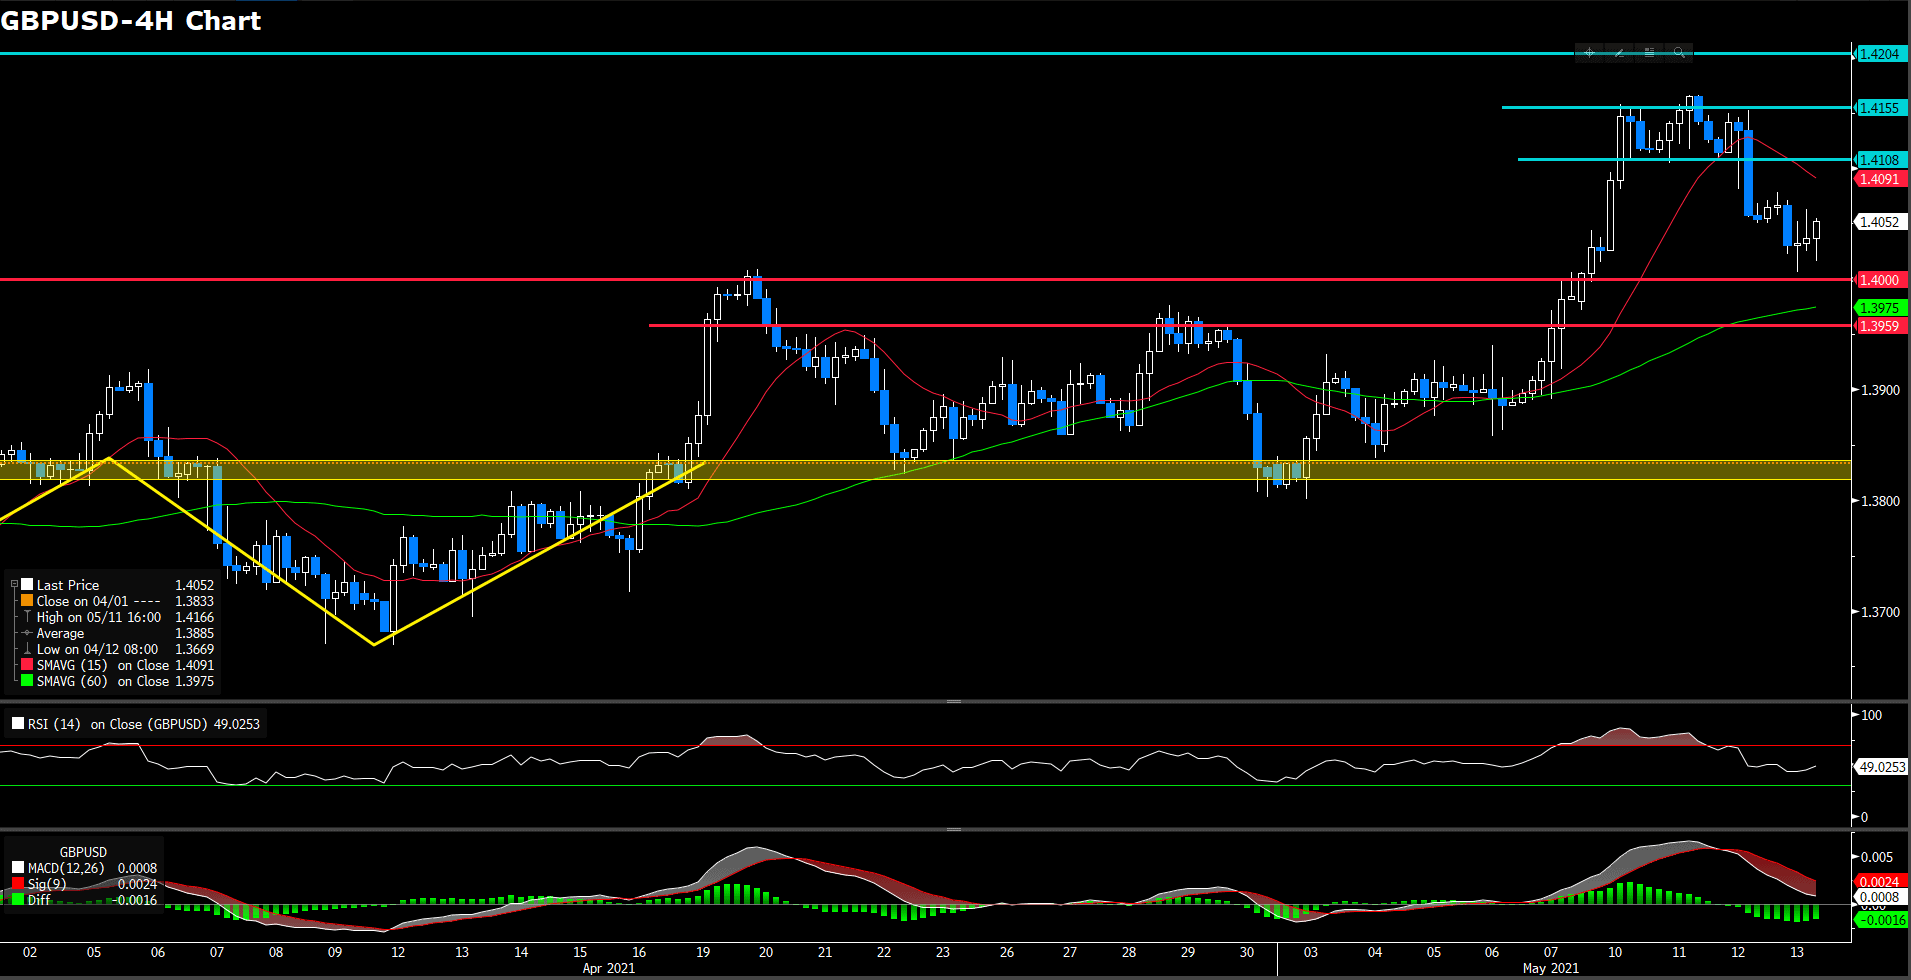
Pound traded with stress below the recently low level as U.S. PPI rose 0.6% in April after surging to 1% in March. For YoY aspect, the PPI boom to 6.2% which is the biggest rise record since 2010. Pound trading at 1.4053 with withhold unmove in the day market. For RSI side, indicator shows 49 figure, suggesting a neutral momentum at this stage. On the other hands, 15-long SMA indicator retain south side trend after hard striked in the day and 60-long SMA indicator remaining a teeny-tiny ascending movement.
Overall the market move in day, pound once poised to testing 1.4 level but pull up after mire in the daily low. In lights of recently perspective, we still foresee 1.4 level would be and have to be the strong support for bullish favour despite faltering movement.
Resistance: 1.4155, 1.42
Support: 1.3959, 1.4
USDCAD (Daily Chart)
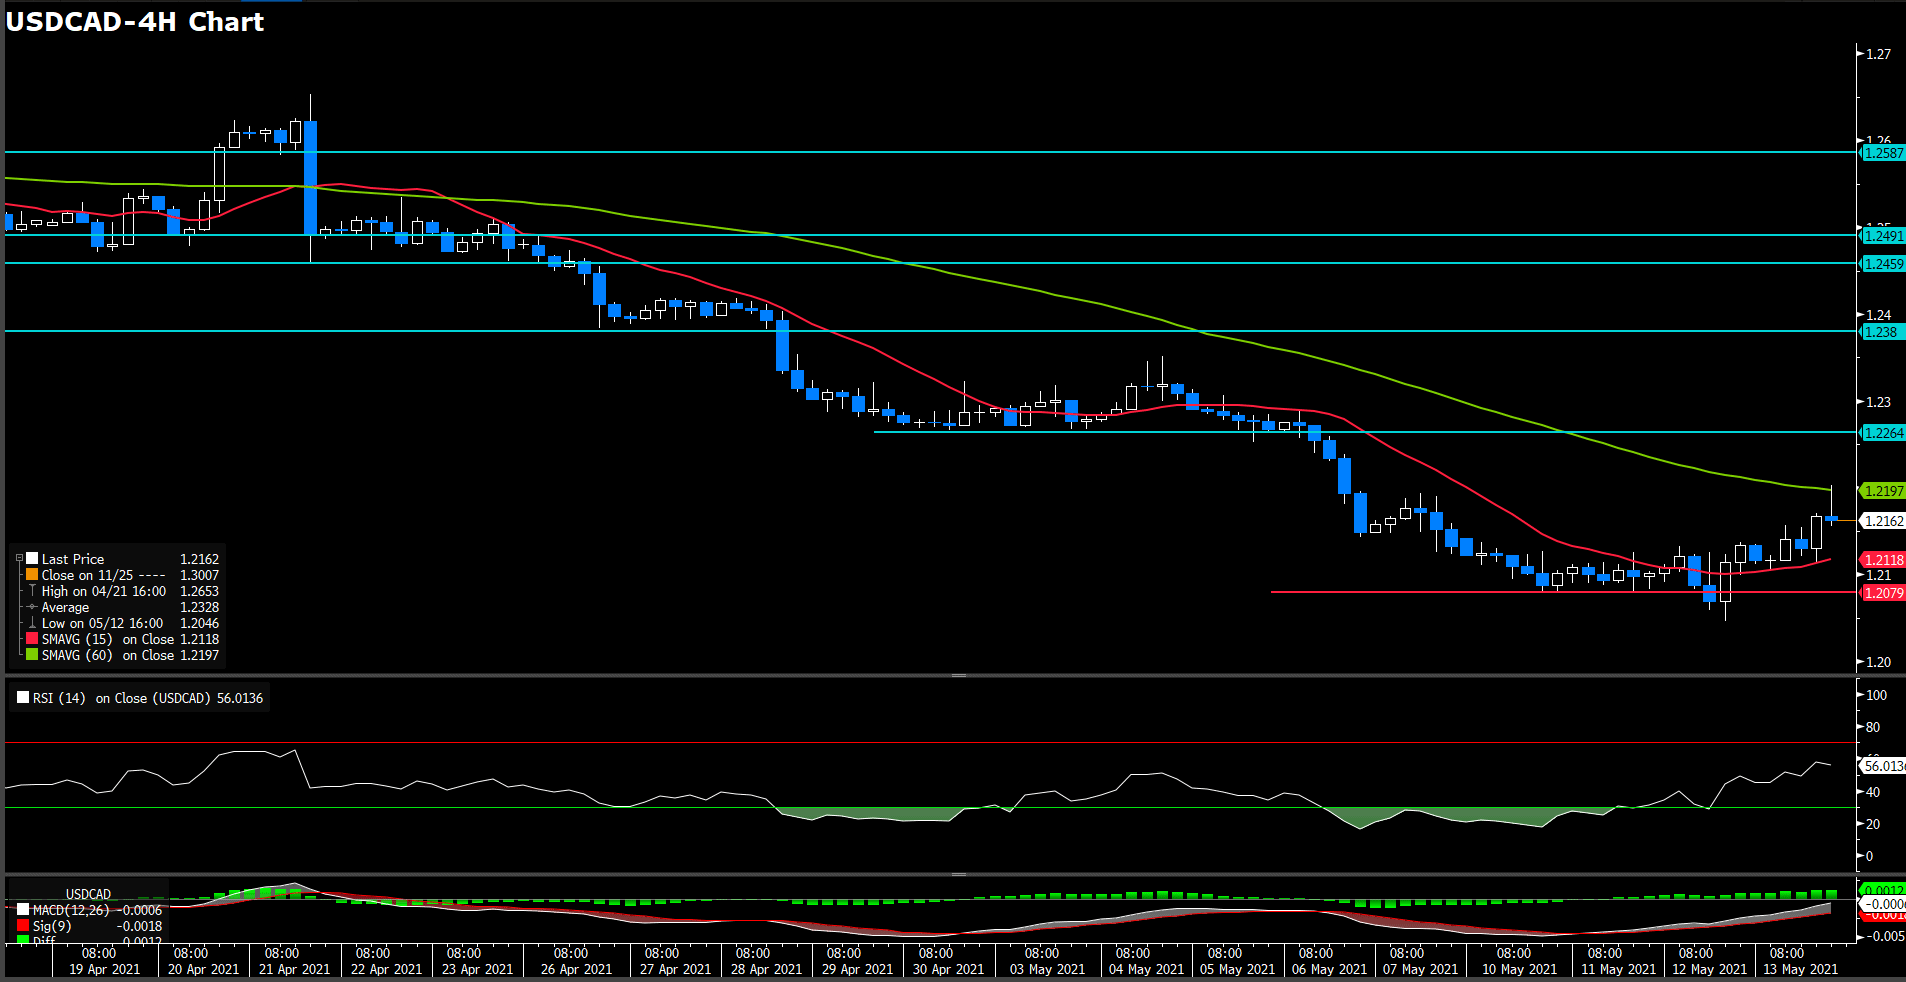
Loonie continue it bounced up trail which once achieved weekly high above 1.22 level then slightly retreated modestly, trading at 1.216 with up 0.24% as of writing. Bank of Canada Governor noted on Thursday that further loonie strength could impact policy decision. Meantime, WTI crude oil drop 3.51% in the day, industrial material wide-ranging retreat it upside traction as greenback missed bullish movement.
For RSI side, indicator continue rallied to higher stage, shows 56 figure which suggest a slightly-bull movement. For moving average side, 15-long SMA indicator remaining upside movement and 60-long SMAs indicator turn it slope to positive way.
As we mentioned recently, loonie successive it correction of bearish traction to higher level, yet, ubdermine the momentum after touched 60 SMA indicator. For currently, we expect market will extend it consolidation movement in range between 1.2264 and 1.2079.
Resistance: 1.2264, 1.238, 1.2491
Support: 1.2079
Economic Data
|
Currency |
Data |
Time (GMT + 8) |
Forecast |
||||
|
EUR |
ECB Monetary Policy Statement |
19:30 |
– |
||||
|
USD |
Core Retail Sales (MoM)(Apr) |
20:30 |
0.7% |
||||
|
USD |
Retail Sales (MoM)(Apr) |
20:30 |
1% |
||||


