Daily Market Analysis
Market Focus
Stocks climbed as Federal Reserve Chairman Jerome Powell said the central bank has the tools to curb any inflation pressures, which are expected to be temporary as the economy reopens.
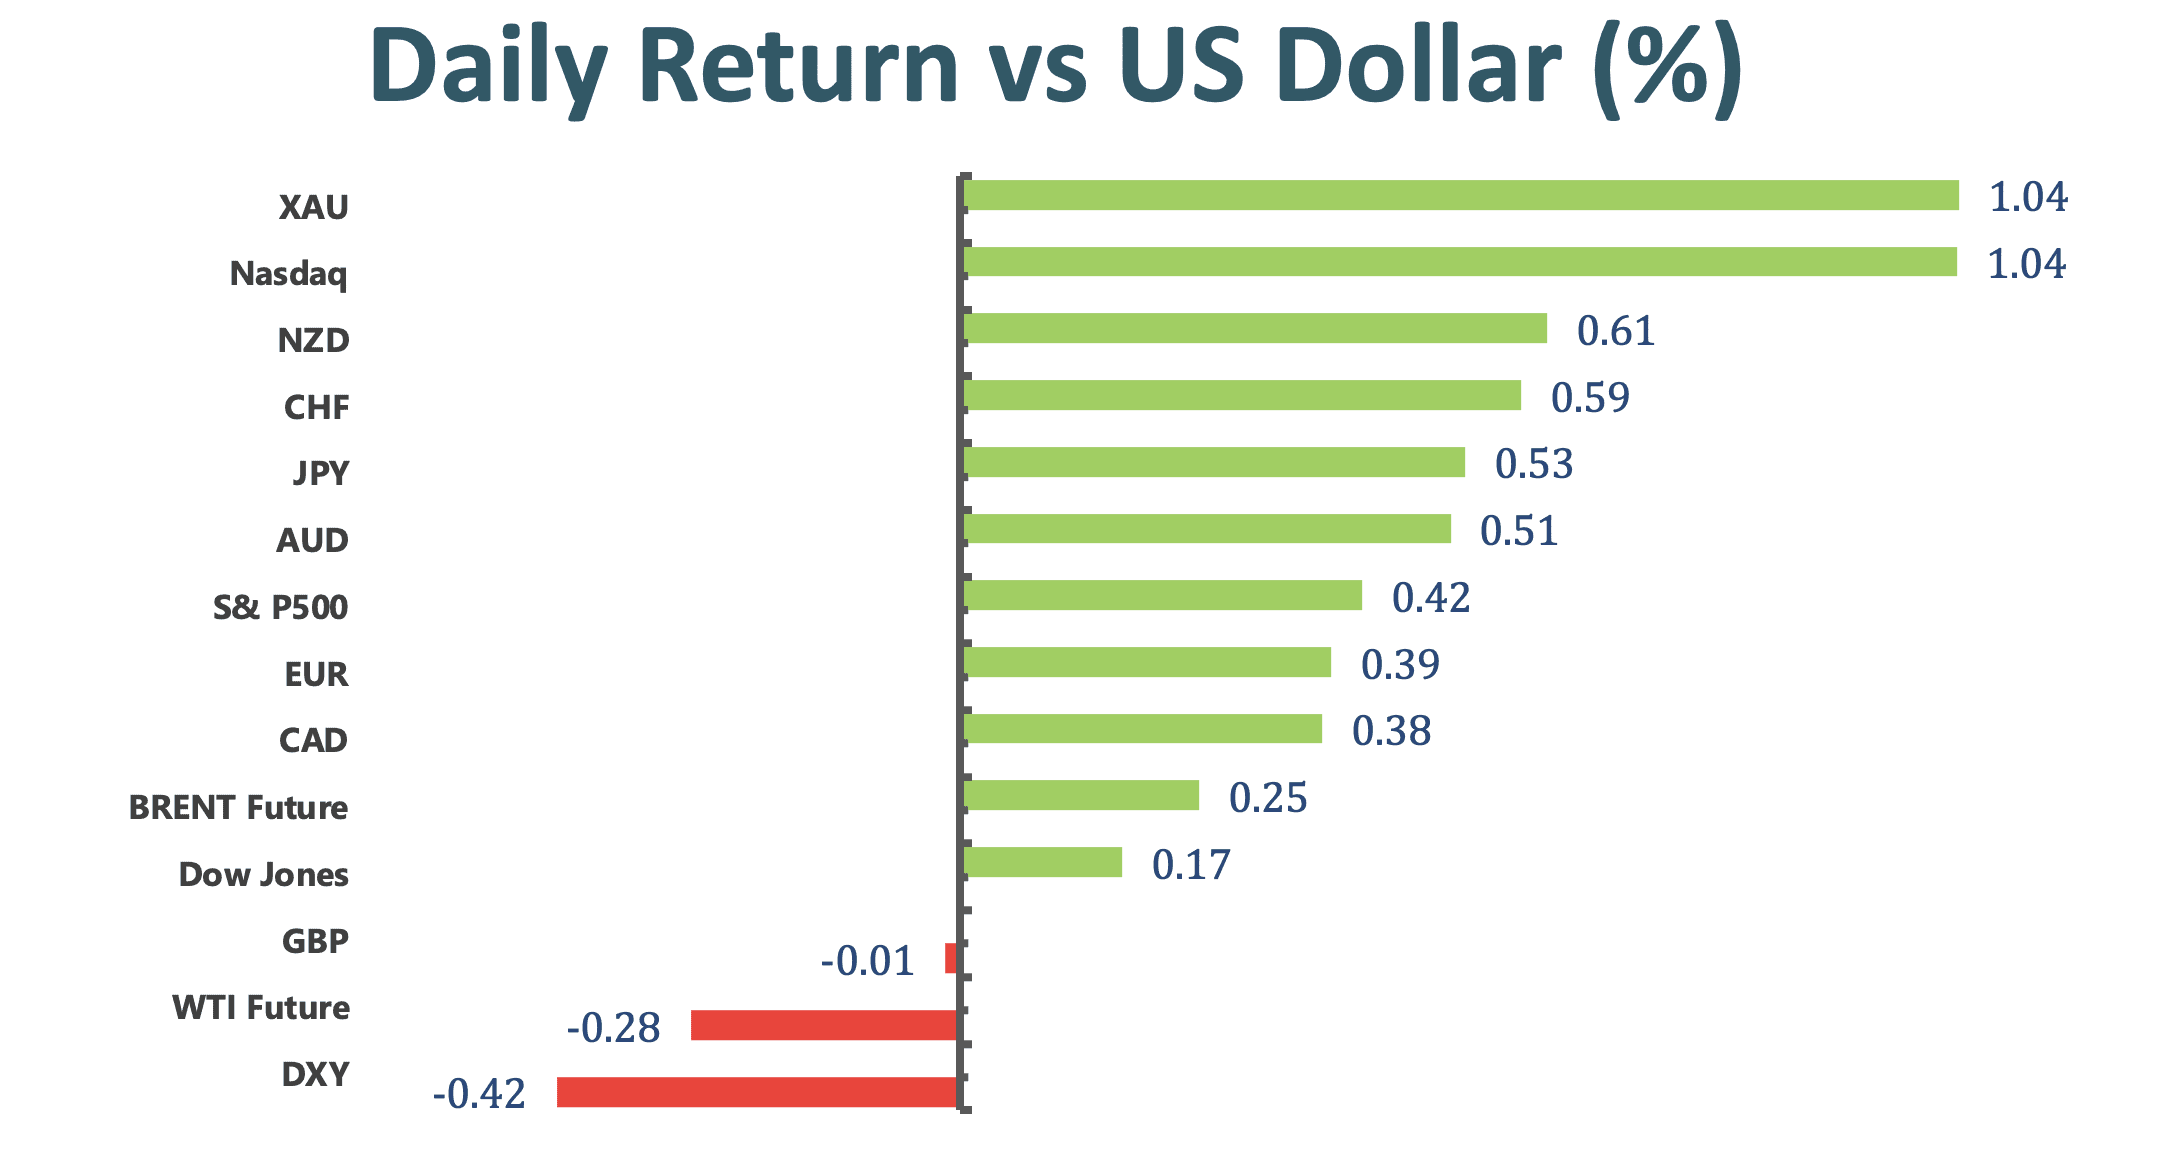
The S&P 500 notched a fresh record amid slow trading. Volume on U.S. exchanges remained under 10 billion shares, hitting another low for the year. The Nasdaq 100 outperformed major equity benchmarks as giants such as Apple Inc. and Tesla Inc. rallied. Energy producers and banks retreated. Treasuries rose, while the dollar fell.
One day after the Fed’s March minutes struck a dovish tone for the path of monetary policy, Powell said the central bank would react if inflation expectations started “moving persistently and materially” above levels officials are comfortable with. He also noted that disparate efforts to vaccinate people globally is a risk to progress for the economic rebound, which remains “uneven and incomplete.”
Meanwhile, Fed Bank of St. Louis President James Bullard said it’s too soon for central bankers to discuss tapering asset purchases as long as the pandemic continues. Data Thursday showed applications for U.S. state unemployment insurance unexpectedly rose for a second week, underscoring the choppy nature of the labor-market recovery.
Market Wrap
Main Pairs Movement:
The dollar retreated with U.S. Treasury yields as Federal Reserve Chairman Jerome Powell said that inflation is not expected to surge out of control and the central bank would take steps to curb it, if necessary. The yen touched the highest level in two weeks on the back of falling yields.
Among G-10 currency peers, the Swedish krona and franc topped counterparts, while the Norwegian krone lagged all. USD/JPY -0.6% to 109.25; fell as much as 0.8%, the most since November; yen earlier hit a session high of 109.90. USD/JPY volatilities are lower across tenors. AUD/USD +0.5% to 0.7649; climbed as much as 0.6% to 0.7660.
Technical Analysis:
EURUSD (Four- Hour Chart)

The euro dollar once hit nearly two-week peak at 1.1925 then tweak down slighty, trading at 1.1913 as of writing. For Moving Average perspective, euro creep up alongside the 15-long SMAs since golden cross days ago whilst 60-long SMAs indicator pick up accelerately. For RSI side, indicator approach to 72.8 figures which suggest a over bought sentiment at current stage.
We expect that recently soared up has enacted a short squeeze which wipe out the short position momentum. Therefore, we believe market will toward to netural or consolidation movement in short term. On up way, we see first resistance at 1.194 if market move consolidation. Subsequently, pivotal resistance will at 1.199 if market beef up further which is entrenched by shoulder level of head pattern in early this year
Resistance: 1.1941, 1.19
Support: 1.1877, 1.1796, 1.1705
GBPUSD (Four-Hour Chart)

At the time of writing, sterling is trading at 1.3734 after it weathered a whipsaw movement intraday. At the meantime, the greenback traded near it lowest in two weeks versus major peers which accord with 10 year Treasuries yield tamp down. On RSI side, indicator shows 37 figure which suggest a bearish outlook at least for short run. Other than this, we see 15-long SMAs has death cross 60-long SMAs.
Therefore, we expect the market will extend it bearish momentum as integrate the suggestion from inidcators. On slid side, first support will be 1.3718 as in spade price cluster in that level, 1.3678 following as last lowest point.
Resistance: 1.377, 1.3848
Support: 1.3718, 1.3678
XAUUSD (Four-hour Chart)
Gold has hand over the fist to breakthrough a tiny range consolidation to higher stage against yesterday slightly movement, trading at 1756.77 level which breached one month high. On RSI side, indicator has reached 73 figure as of writing, suggesting a over bought sentiment. On the other hand, 15 and 60-long SMAs indicator are both retaining the ascending trend after golden cross days ago.
Currently, we expect the gold market will high probability cool off the edge up movement in short term as it relatively have a too strong momentum. However, for long term perspective, it still have a prosperity on long side as it stand above the resistance of “W shape” pattern. On slid side, the critical support level at 1754 around need to be defended which stand for a shoulder level of “W shape” pattern.
Resistance: 1759.7
Support: 1754.5, 1737.7, 1678.85
Economic Data
|
Currency |
Data |
Time (GMT + 8) |
Forecast |
||||
|
USD |
PPI (MoM)(Mar) |
20:30 |
0.5% |
||||
|
CAD |
Employment Change (Mar) |
20:30 |
100K |
||||


