Daily Market Analysis
Market Focus
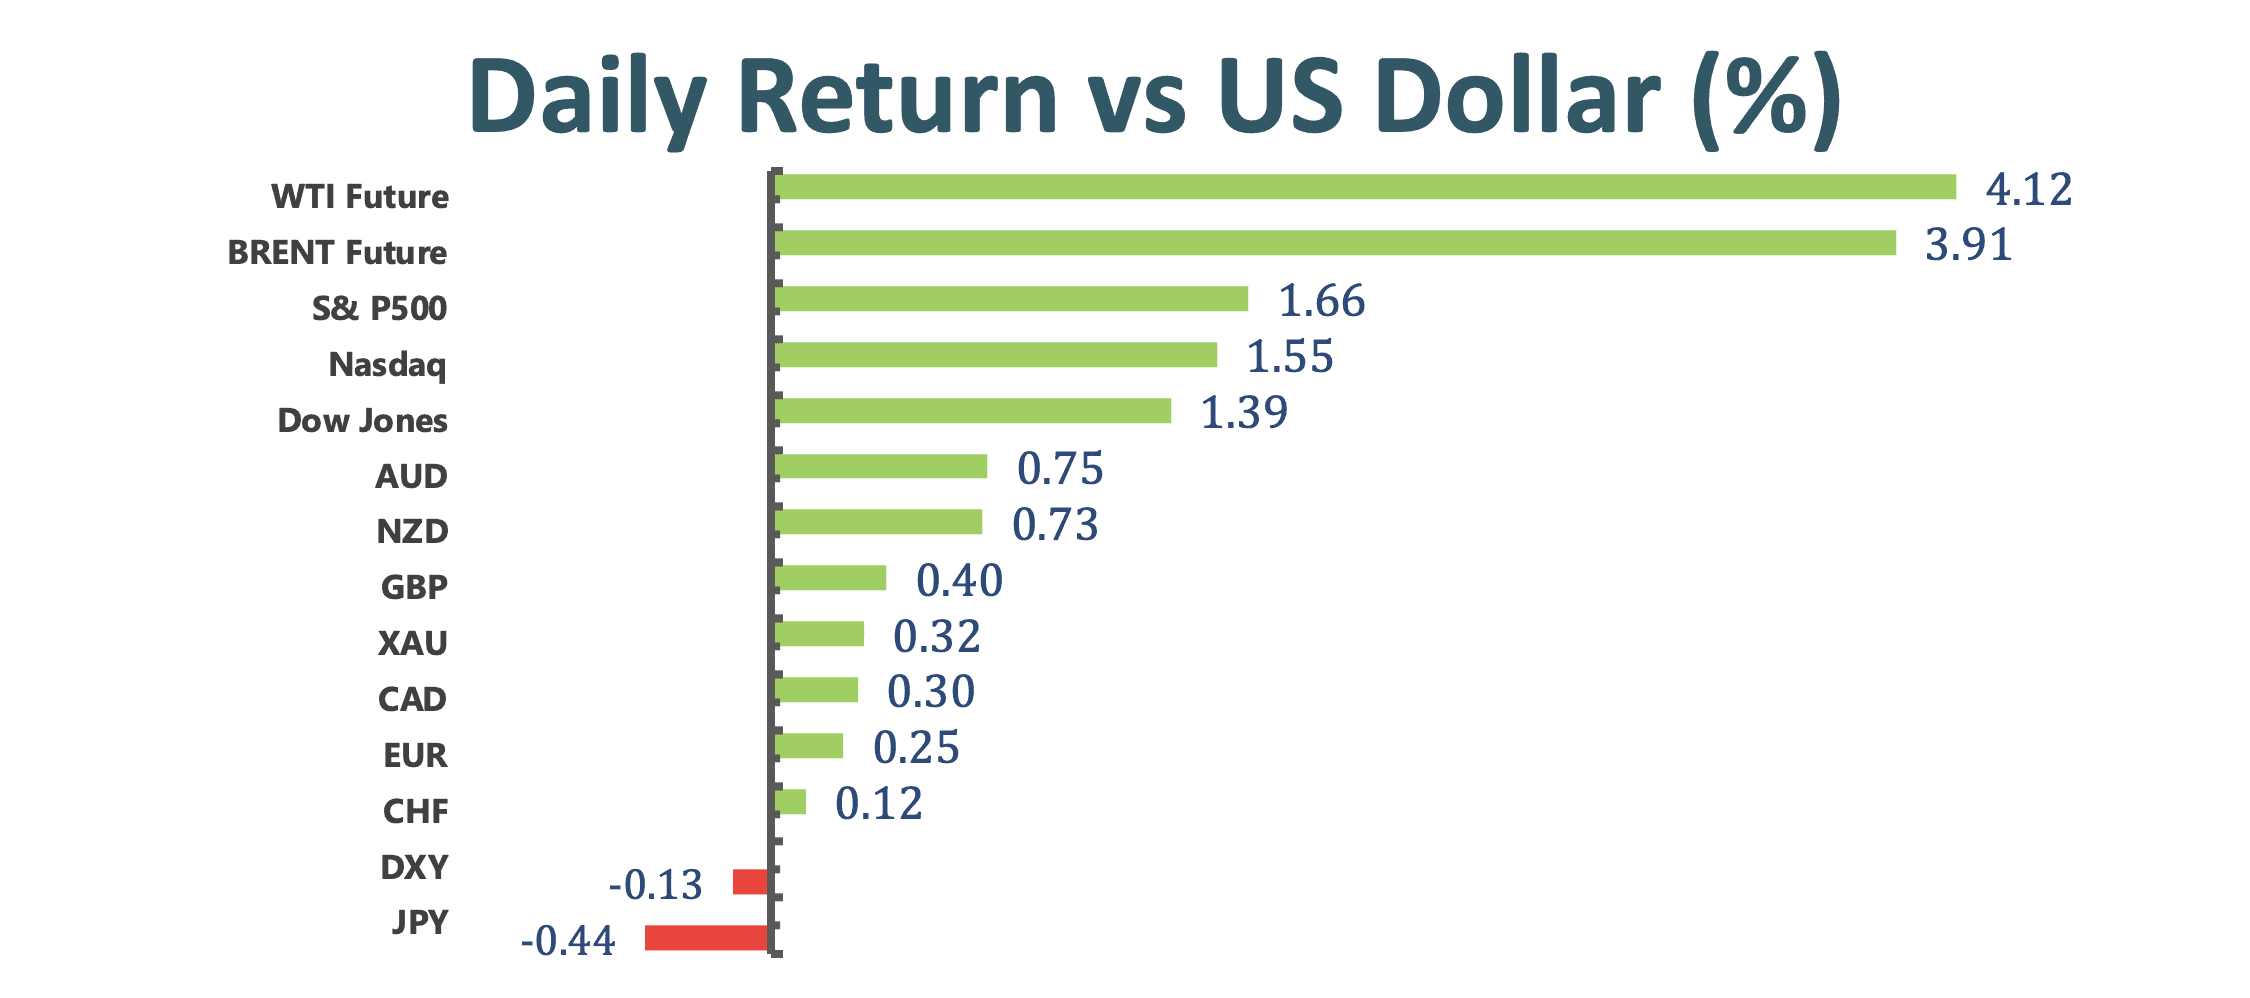
US equities climbed on optimism over the vaccine rollout and after the Fed freed banks from restrictions on dividends. The US outlook got boosted after Joe Biden doubled the goal for vaccinations in his first hundred days in office to 200 million. Today, the tone of the market has shifted from angst to optimism.
The blockage of Suez Canal is further stressing an already strained supply chain. It is holding up an estimated $400 million per hour in trade, calculated based on the approx. value of goods that are moved through the canal every day. Despite of trying to remove the megaship, Ever Given, it remains stuck in the Suez Canal, and is likely to stuck until next week. This incident has opened up the challenge for global supply chain, and now is only the start of the rearranging of global trade.
US and European retail brands, such as Nike and H&M, face boycotts in China as Xinjiang dilemma deepens, over Xinjiang cotton statement. The boycott is because of the stand the retailers have taken against the alleged use of forced labor to produce cotton in Xinjiang, part of China. Moreover, Chinese government is seeking to impose real costs for governments and businesses that criticize and impose sanctions on China’s human right issue.
Market Wrap
Main Pairs Movement
Gold advanced today, narrowing a weekly loss as the US dollar slipped and bond yields is stable. However, gold is still heading for its first weekly loss, underscoring its fitful comeback from a nine- month low. As more and more countries are recovering from the pandemic, and the US dollar is resilient, many factors potentially reduce the appeal of non- interest- bearing gold.
The British Pound climbed against the US dollar toward 1.38 after the UK reported an increase of 2.1% in retail sales in February. With the retail sales report of over 2%, it shows the resilience of the UK economy, boosting the GBP.
The Aussie plunged to its lowest since early February at 0.7563 although it bounced back a little today due to the risk sentiment improvement.
USDJPY prolonged its upward momentum, currently at 109.67 today. The risk- on mood weighed on the safe heaven Japanese Yen and continued to remain supportive of the move up.
Technical Analysis:
EURUSD (Daily Chart)
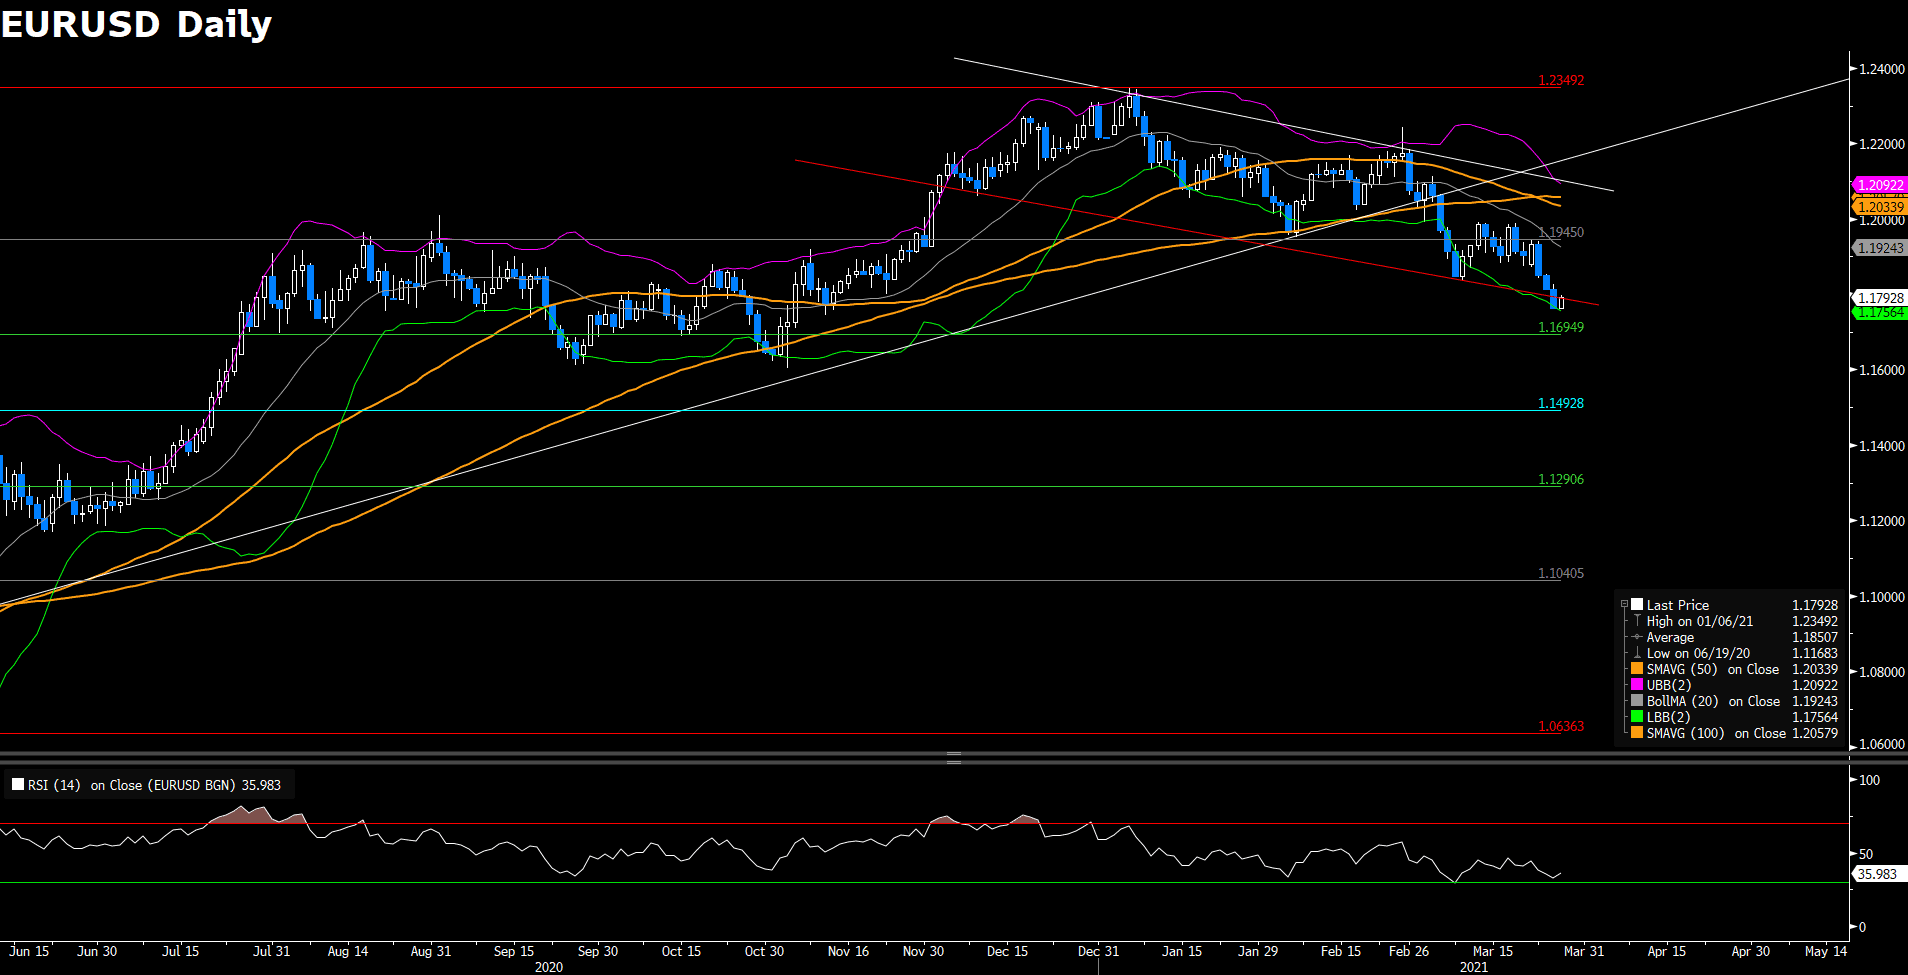
EURUSD hovers under 1.18 after the concern of EU bans on vaccine exports and the possibility of the third wave. On the daily chart, the pair has broken the descending channel, opening up a more confirmed downside pressure and heading toward the next support at 1.16949. To the downside, EURUSD has formed a double top, a bearish reversal pattern. Moreover, the pair is trading below the 50 and 100 SMAs while the RSI is slight above 30, which is outside of the oversold conditions, implying a further falls in the next few trading sessions.
Resistance: 1.19450, 1.23492
Support: 1.16949, 1.14928, 1.12906
USDJPY (Daily Chart)
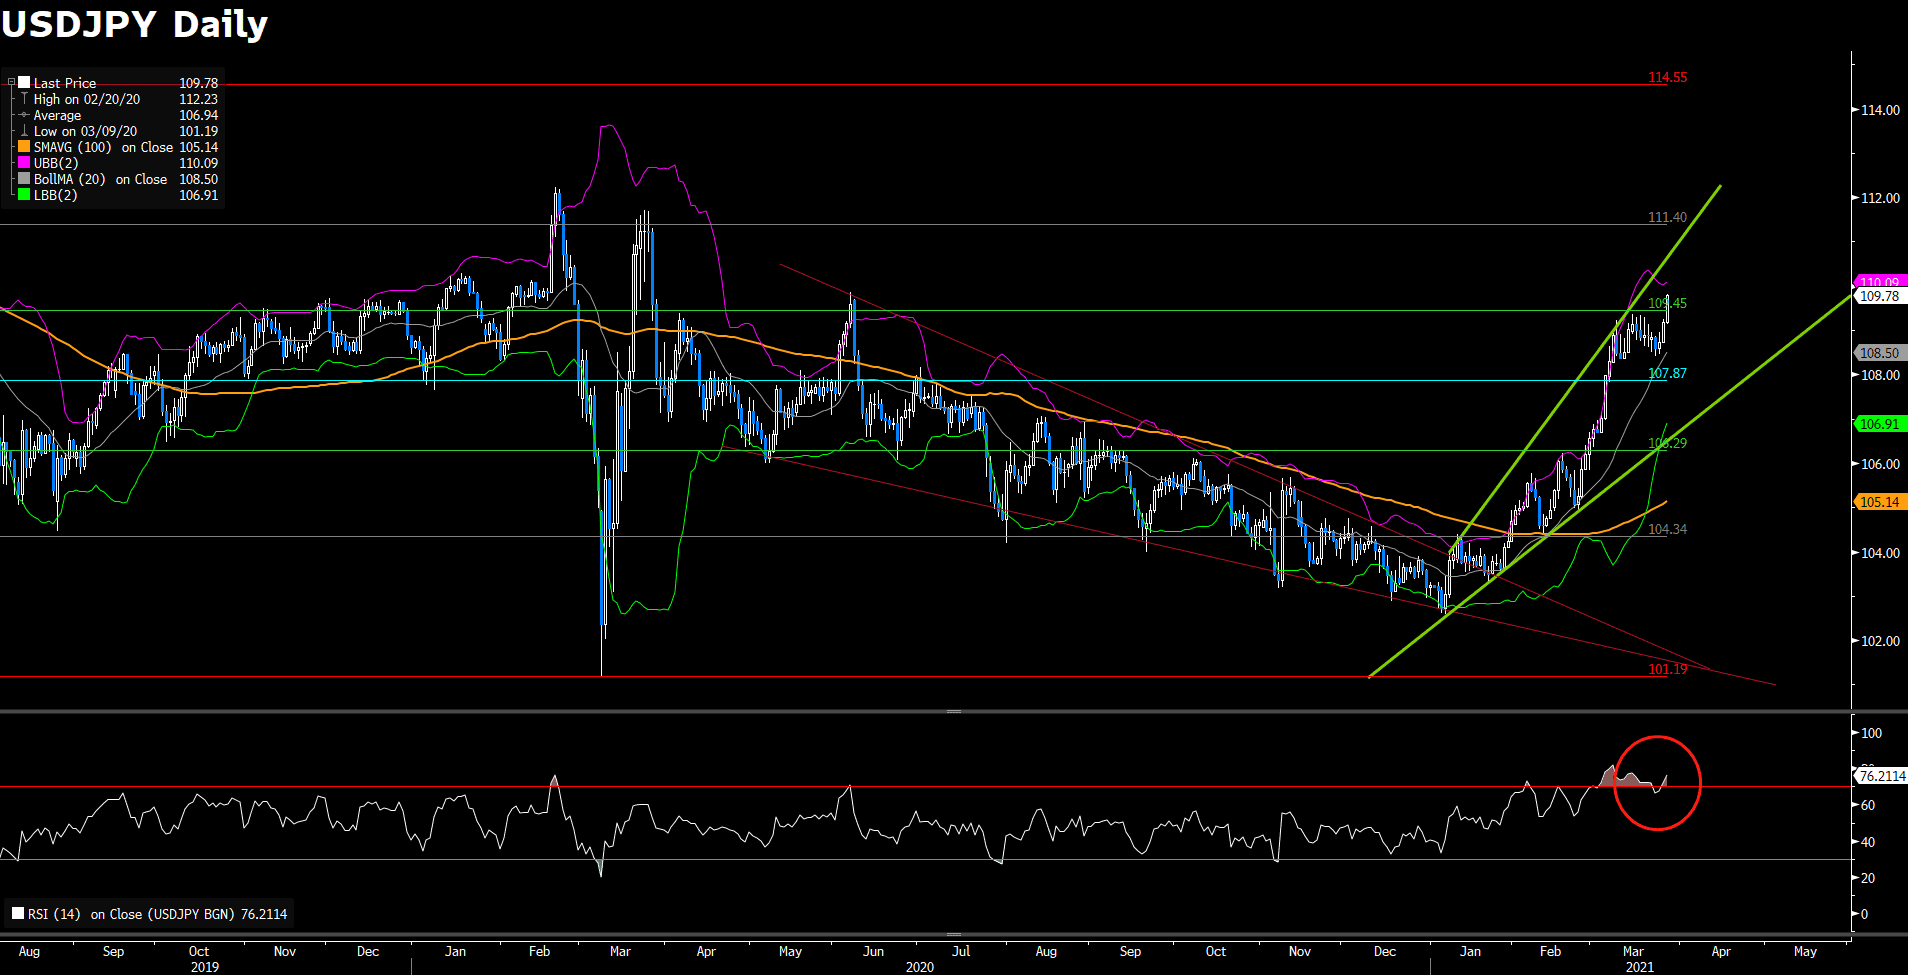
After clinging in between 107.87 and 109.45 for more than a week, Dollar Yen finally breaks through the resistance at 109.45. USDJPY prolongs its recent upward trajectory and reaches multi- month highs today. The pair continues to trade within the ascending channel and outplayingly above the 50 SMA, confirming a fresh bullish momentum toward the next resistance at 111.40. However, the bullish momentum might be hold a little as the RSI on the daily chart is currently overbought, 76; USDJPY buyers might sense some caution before positioning for any further positive move.
Resistance: 111.40, 114.55
Support: 109.45, 107.87, 106.29
XAUUSD (Daily Chart)
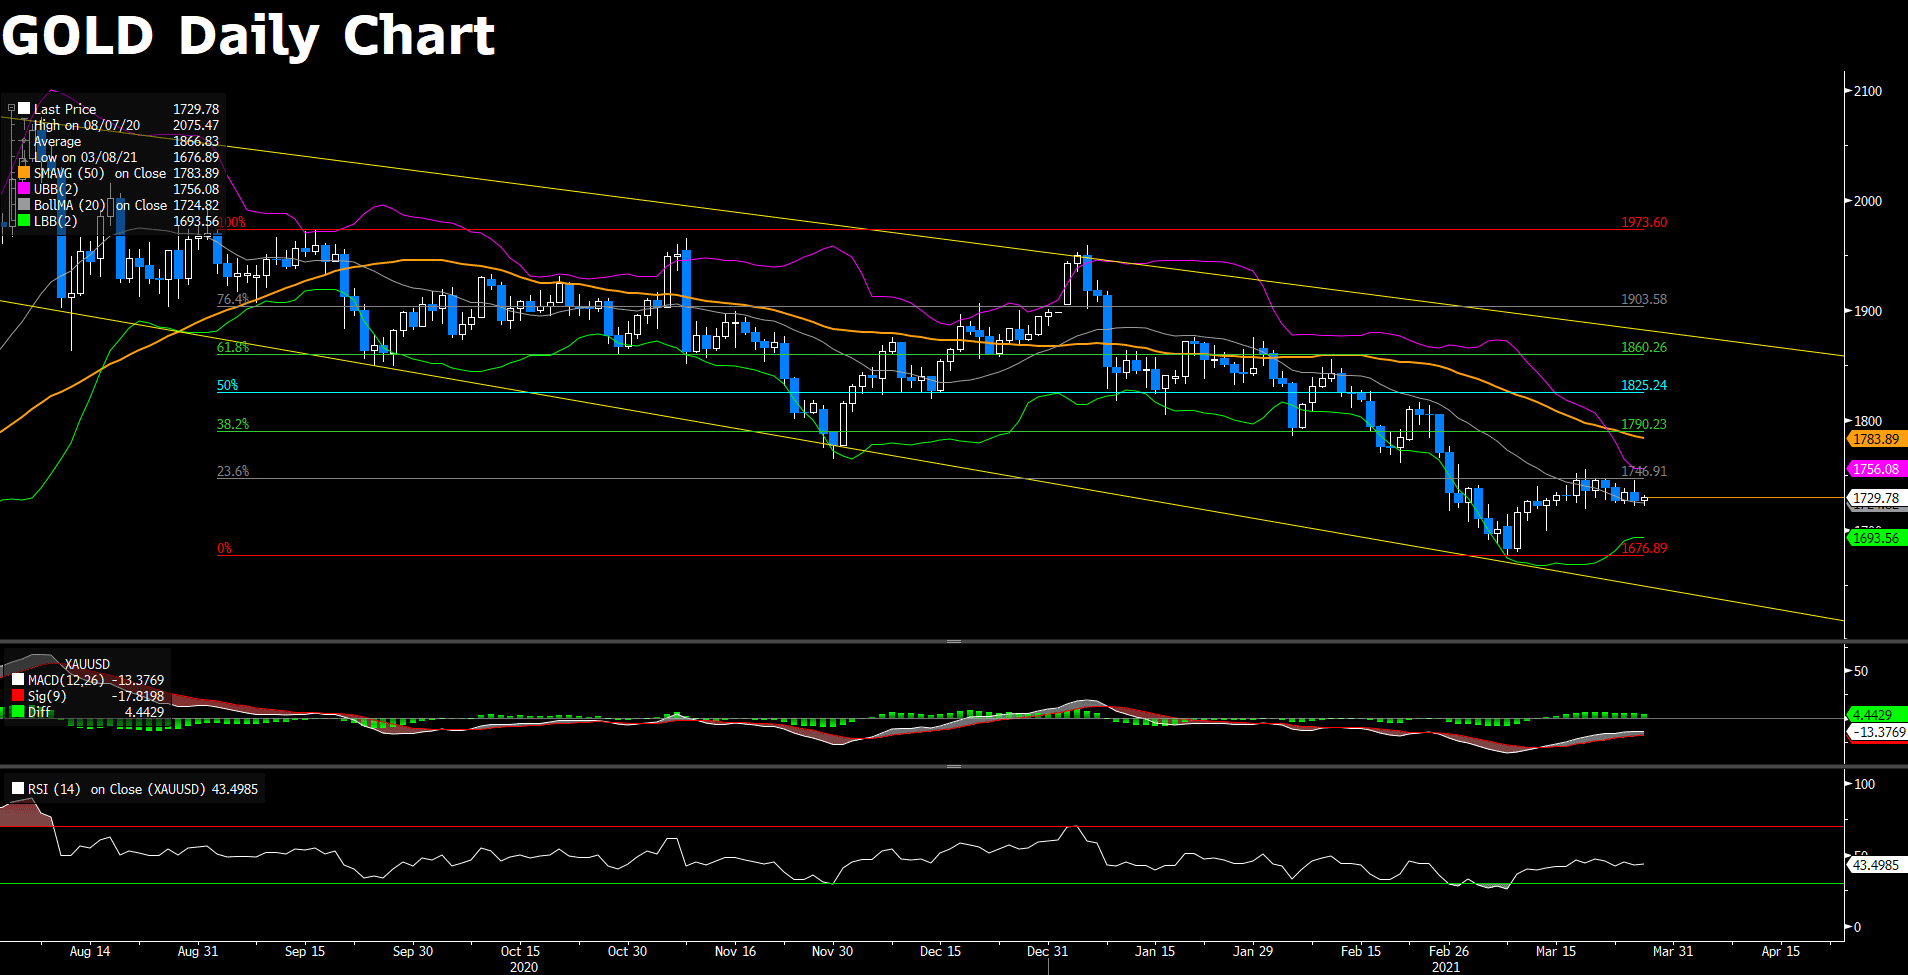
After once again testing the resistance at 1746.91, gold witnesses some selling today. At the moment, gold continues to hover near the resistance boundary of its weekly range in between 1720 and 1746. Gold remains locked in a tight range on the daily chart, looking for a fresh direction. To the downside, gold still trades below the 50 SMA; at the same time, the RSI of 43 remains below the midline, suggesting that the bearish bias still remains intact. On the upside, as gold continues to hover around the resistance, the upside bias is relatively strong, waiting for the time to break through; in the meanwhile, the MACD still lends support to the bulls.
Resistance: 1746.91, 1790.23, 1825.24
Support: 1676.89
Economic Data
|
Currency |
Data |
Time (GMT + 8) |
Forecast |
||||
|
USD |
US Federal Budget |
Tentative (Saturday) |
N/A |
||||
|
GBP |
Nationwide HPI (MoM) |
14:00 |
N/A |
||||
|
GBP |
Nationwide HPI (YoY) |
14:00 |
N/A |
||||
|
BRL |
BCB Focus Market Readout |
19:25 |
N/A |
||||


