Daily Market Analysis
Market Focus
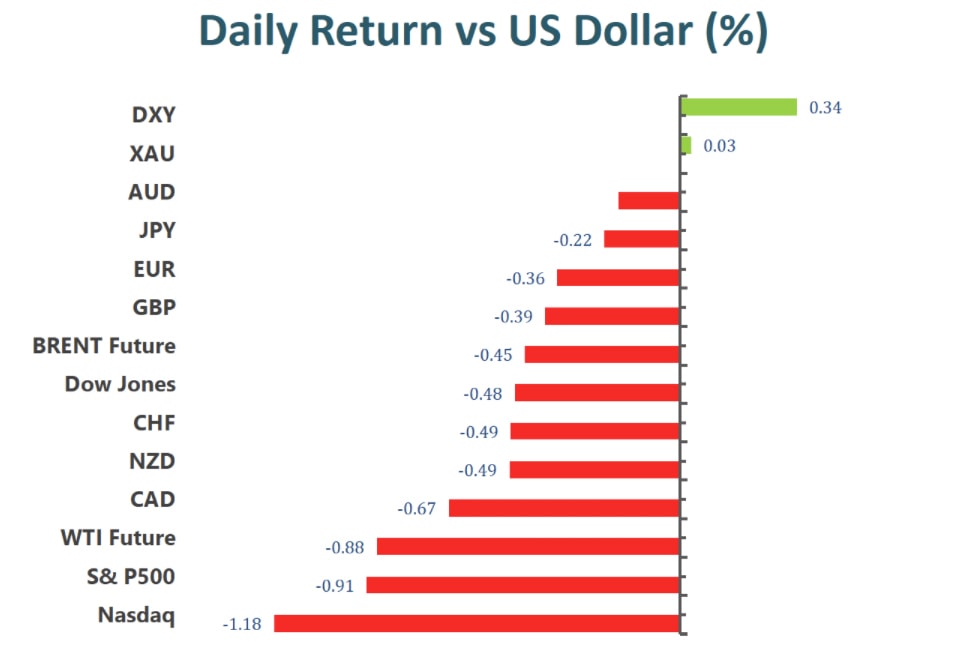
US stocks declined on Friday, touching the lowest levels in four weeks. Investors now are evaluating the resilience of the global recovery amid concerns about the delta virus and risks from China. On top of that, Friday is the day of quarterly expiration of options and futures, which can create volatility. Oil slipped, while gold advanced.
The benchmarks, S&P 500, Dow Jones and NASDAQ both dropped on Friday. S&P 500 was down 0.9% on a daily basis, the index edged lower for a second day and erased its gains from earlier in the week. The material, utilities and technology sectors are the worst performing among all groups, dropped 2.06%, 1.59% and 1.52%, respectively. The NASDAQ, in the same way, finished in positive territory for a third day. Global stock market struggled to maintain optimism in the face of a likely pending change in Fed’s taper plan, slower economic growth and high inflation.
From economic data’s angle, the University of Michigan’s preliminary sentiment index was released on Friday, showing that US consumer sentiment rose slightly but remained close to a decade low. High prices also result in deteriorated buying conditions. The Fed will probably hint at its meeting next week on the timeline of bond tapering and make a formal announcement in November.
In Asia, stock markets were mixed as the debt crisis at China Evergrande Group continued. Casino stocks extended their losses amid tightening regulations in Macau.
Main Pairs Movement:
US dollar advanced on Friday, touching the highest level since August 27. The Dollar Index started to gain bullish momentum in the beginning of American session and pushed higher after the U.S. Michigan Consumer Sentiment index released. Consumer confidence in the US improved modestly in September with the Index rising to 71 from 70.3 in August. This reading came in slightly weaker than the market expectation of 72.2. The DXY index rose 0.4% on a daily basis. Market focus now shifts to next week’s FOMC meeting, as investors expect Fed to give more hints about the timeline of bond tapering.
EUR/USD and GBP/USD both declined on Friday amid stronger US dollar across the board, losing 0.33% and 0.38% for the day, respectively. The EUR/USD pair continued its slide, dropping to a fresh monthly low during American trading hours. The Eurozone Core Consumer Price Index (YoY) rose by 1.6%, in line with expectations. Meanwhile, the Core CPI for August (MoM) also edged higher by 0.3%. As for the cable, Bank of England will announce their interest rate decision on September 23.
Gold advanced slightly on Friday. After climbing to a daily high during European session, gold lost its traction and dropped below $1,750 amid renewed USD strength. The precious metal posted a 0.05% gain on a daily basis. WTI Crude Oil, on the contrary, dropped more than 0.9% on Friday.
Technical Analysis:
GBPUSD (4-hour Chart)
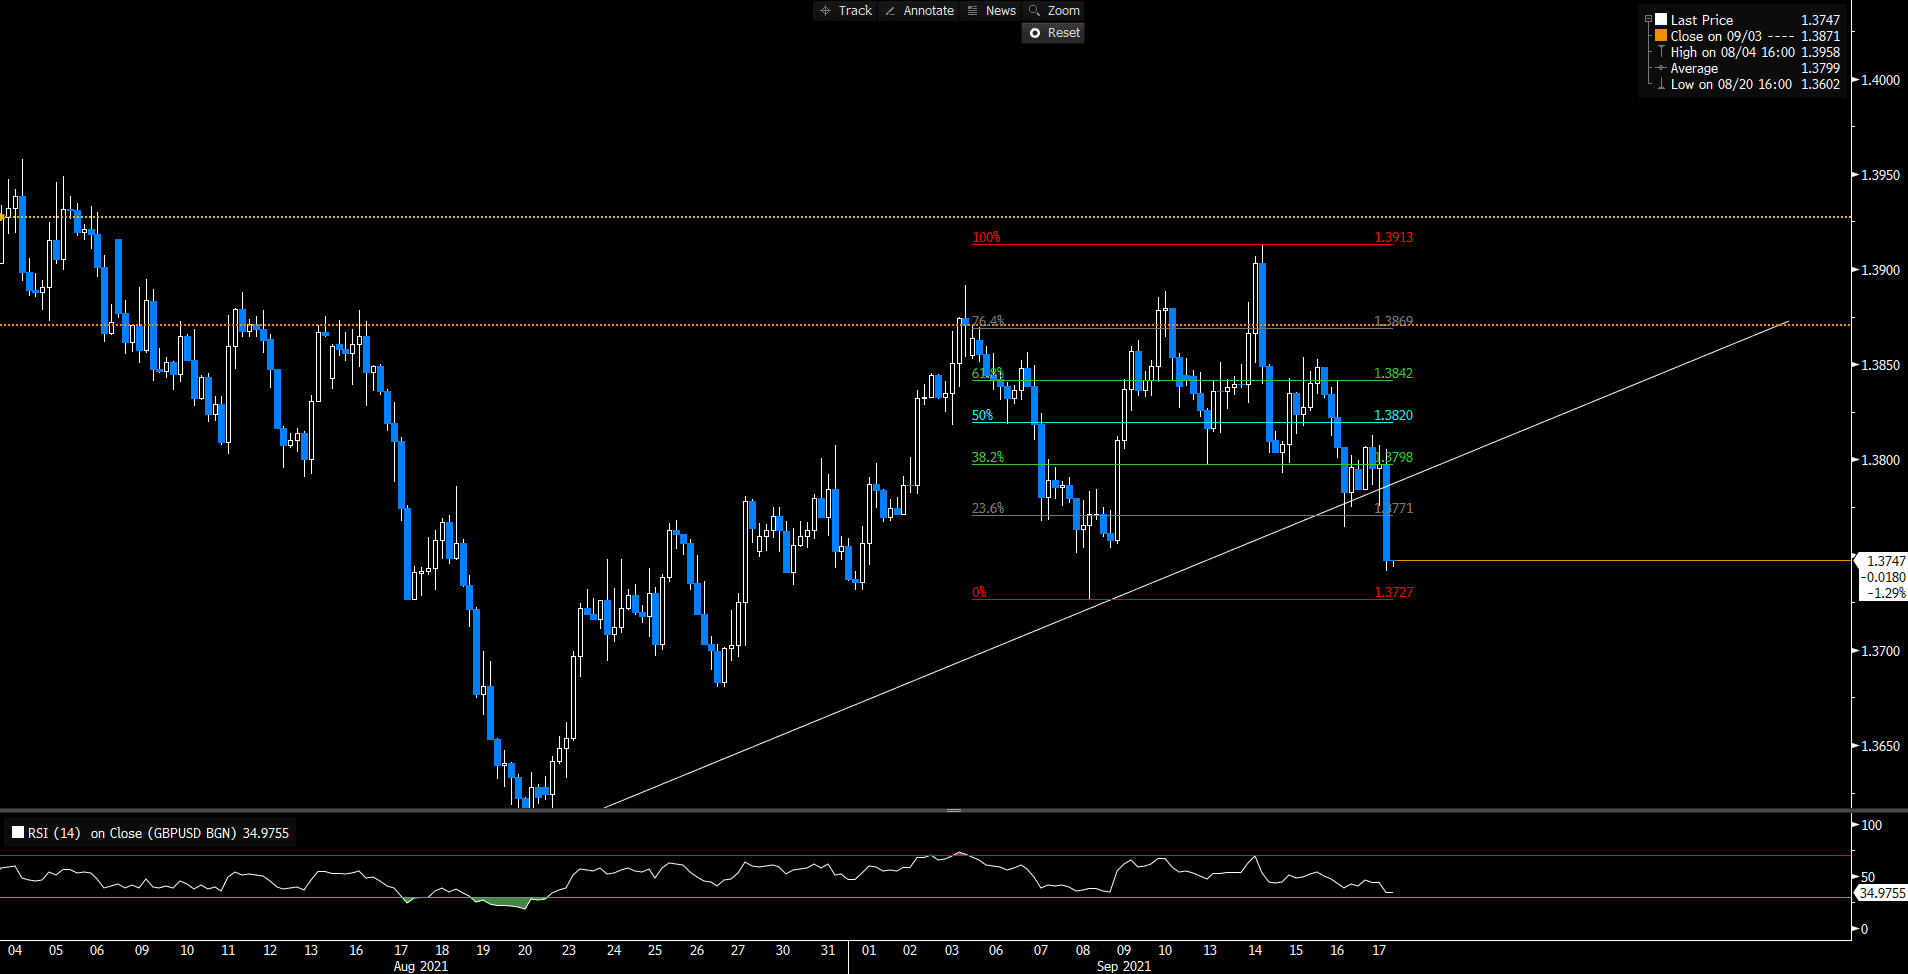
GBPUSD trades under 1.3800 level, on the back foot after UK’s disappointed Retail Sales data, -0.9% in August. From the technical aspect, the intraday bias looks bearish as GBPUSD falls below the ascending trend line, indicating that the upside momentum has been overturned on the four- hour chart. The bearish move is expected to continue as the RSI has not reached the oversold territory, giving more rooms for the pair to extend further south. Bears might continue to head toward the next immediate support level at 1.3727.
Resistance: 1.3771, 1.3798, 1.3820
Support: 1.3727
EURUSD (4- Hour Chart)
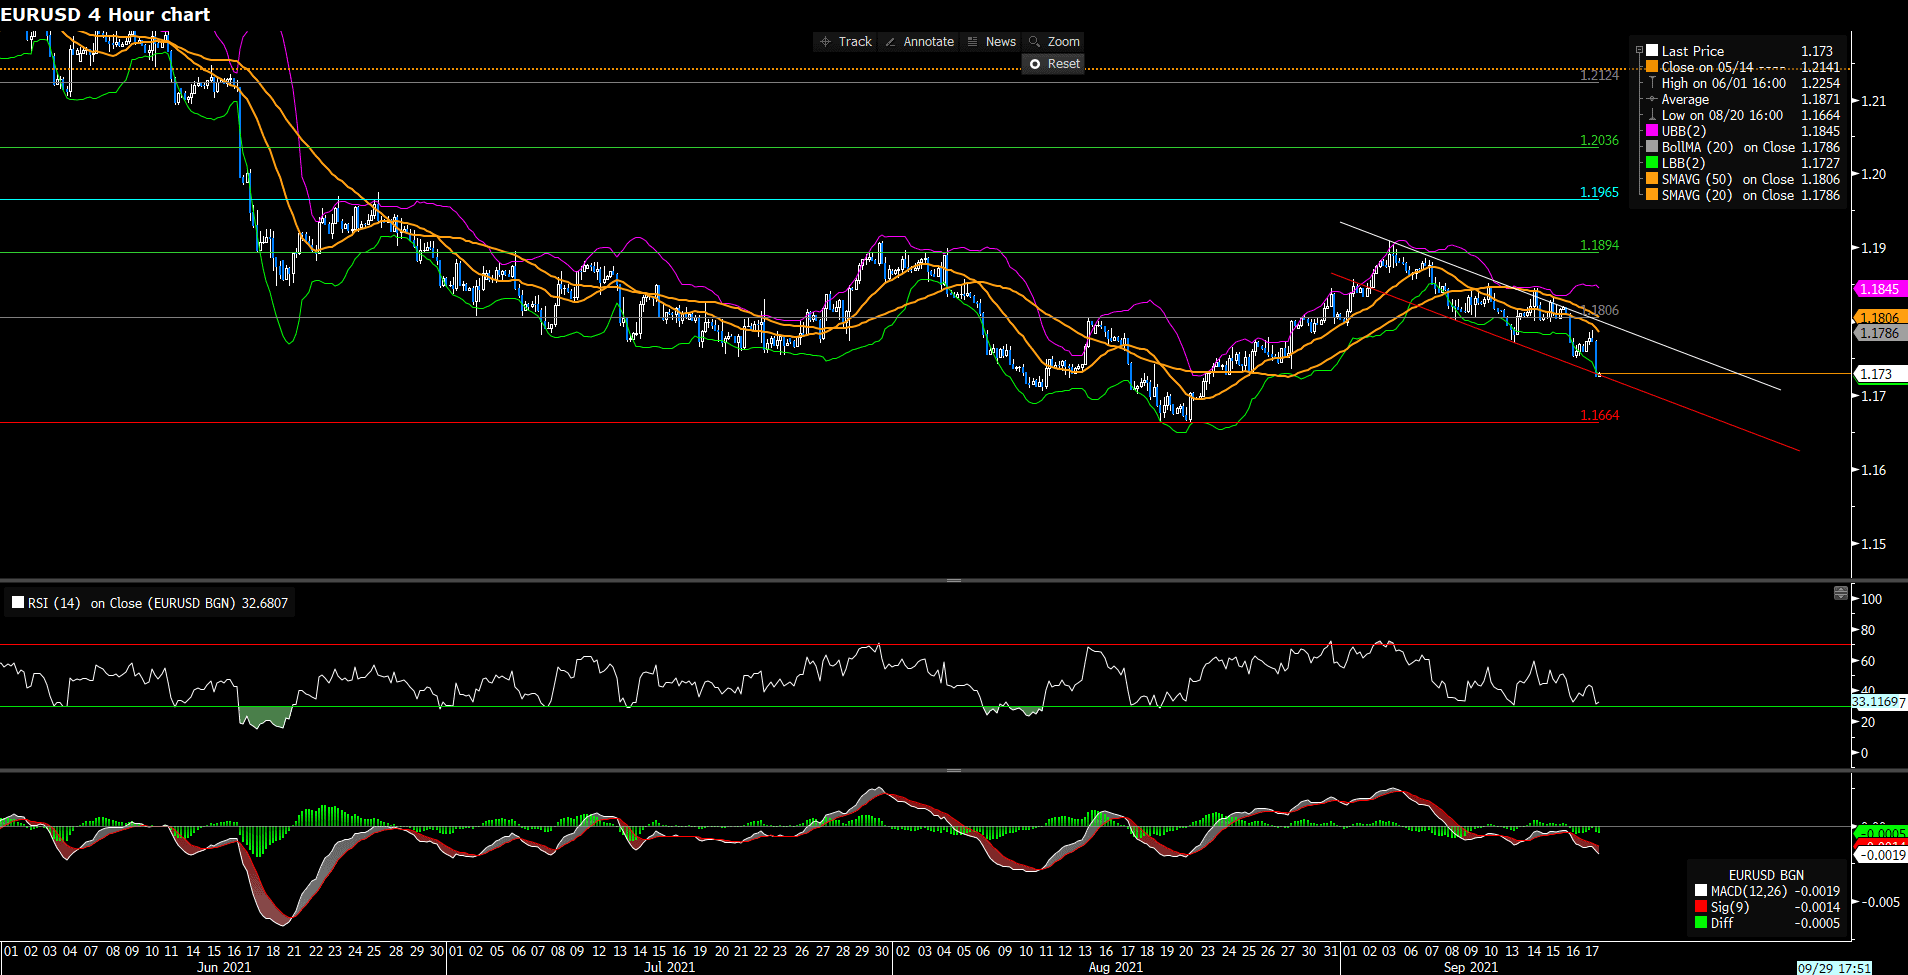
EURUSD trades below 1.1800 level, remaining pressured after the US Consumer Sentiment missed estimates in September. From the technical perspective, EURUSD continues to trade negatively as the pair still trades within the descending channel. At the same time, technicals are pointing lower since the pair fails to climb above the 20 and the 50 SMAs. The RSI on the four- hour chart is above 30, thus outside oversold territory, whilst the MACD is negative, lending supports to bears; that being indicated, EURUSD is still on the downside. Nonetheless, the downside might face some obstacles as the pair has reached the lower bound of Bollinger Band, due for a pullback.
Resistance: 1.1806, 1.1894, 1.1965
Support: 1.1664
XAUUSD (Daily Chart)
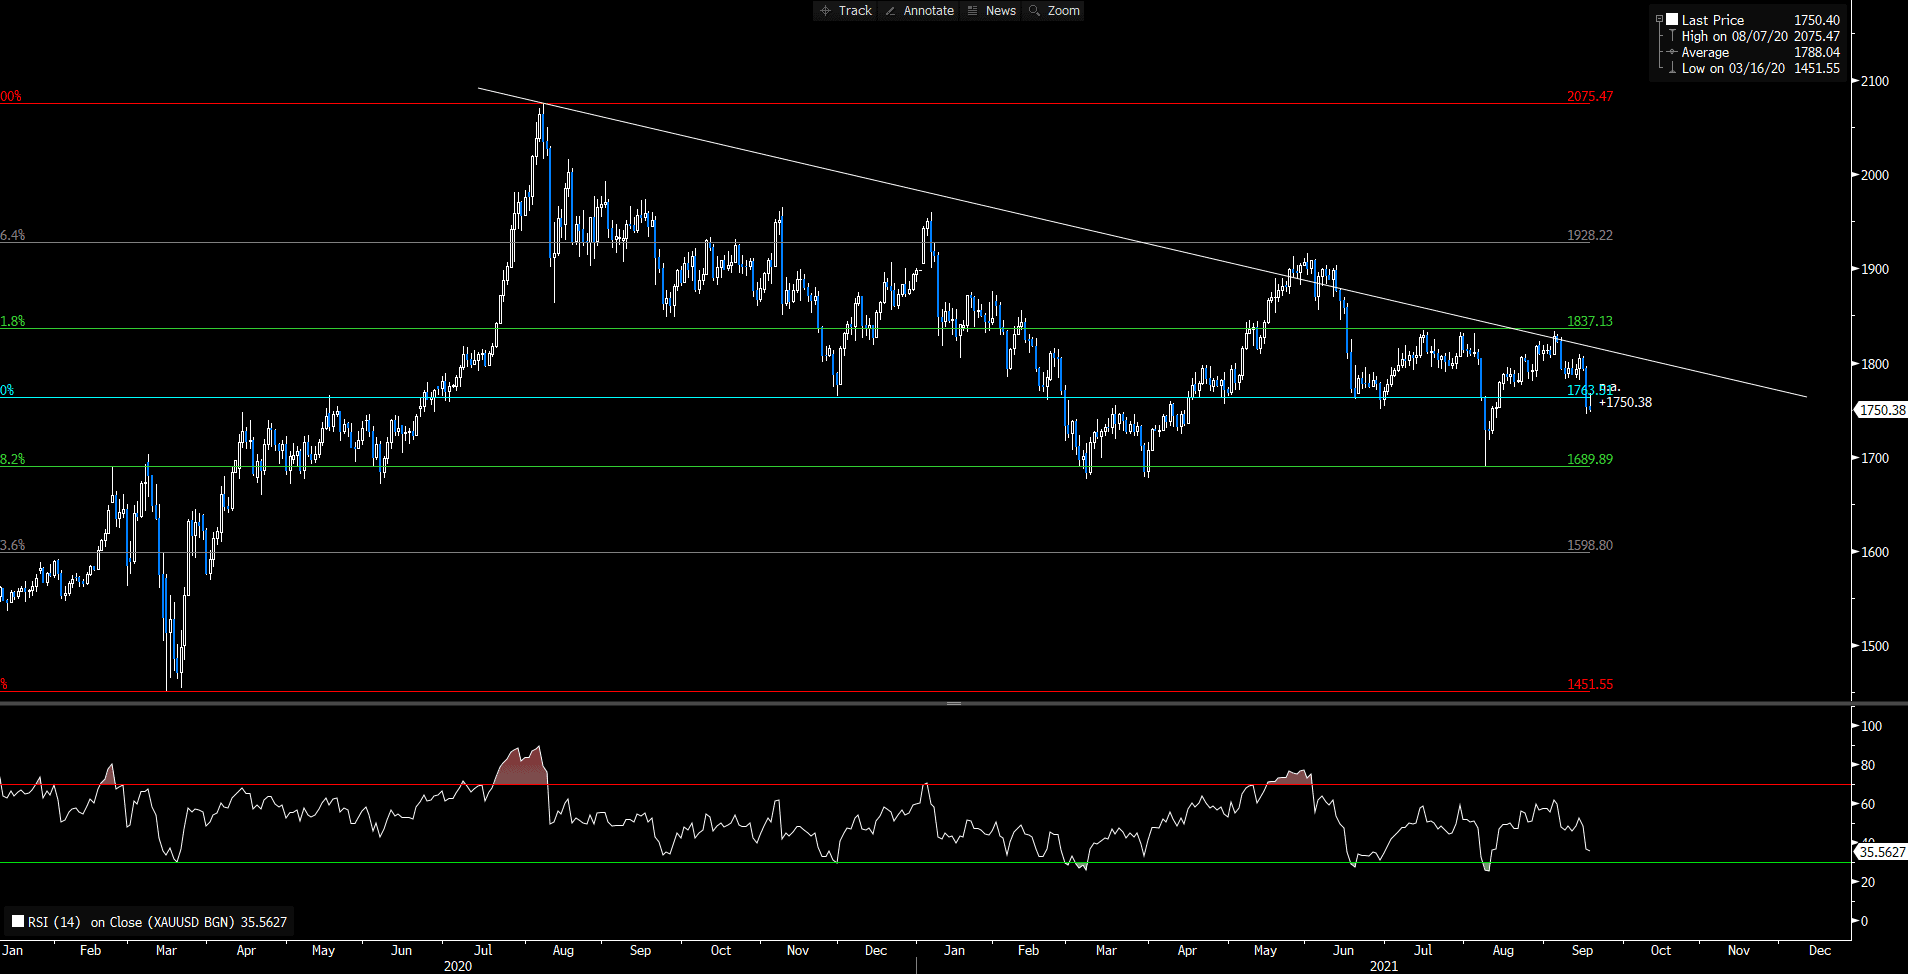
From the technical aspect, the price of gold is currently in a descending triangle on the daily chart, with the bottom support line at 1756.90 and the resistance at around $1800. As mentioned earlier, the price of gold formed support near $1753 after a sharp drop on Thursday, and the RSI indicator was in the oversold area. Therefore, the next trend of gold should be able to take a breather with its small rebound. On the other hand, on the 1-hour chart, based on Fibonacci indicators, the short-term resistance is at the level of $1,765.58, and the next resistance is at the level of 1,778.62. All in all, the long term movement for the gold is downside.
Resistance: 1763.51, 1837.13, 1928.22
Support: 1689.89, 1598.80
Economic Data
|
Currency |
Data |
Time (GMT + 8) |
Forecast |
||||
|
EUR |
German PPI (MoM) (Aug) |
14:00 |
0.8% |
||||
|
BRL |
BCB Focus Market Readout |
19:25 |
N/A |
||||


