Daily Market Analysis
Market Focus
US stock declined after a less-than-expected CPI data was released on Tuesday. The so-called core CPI increased 4.0% in August on a year-on-year basis after advancing 4.3% in July, which offer some validation of views among Fed officials that high inflation will be temporary, meanwhile, increasing uncertainties for the timing of Fed’s bond tapering.
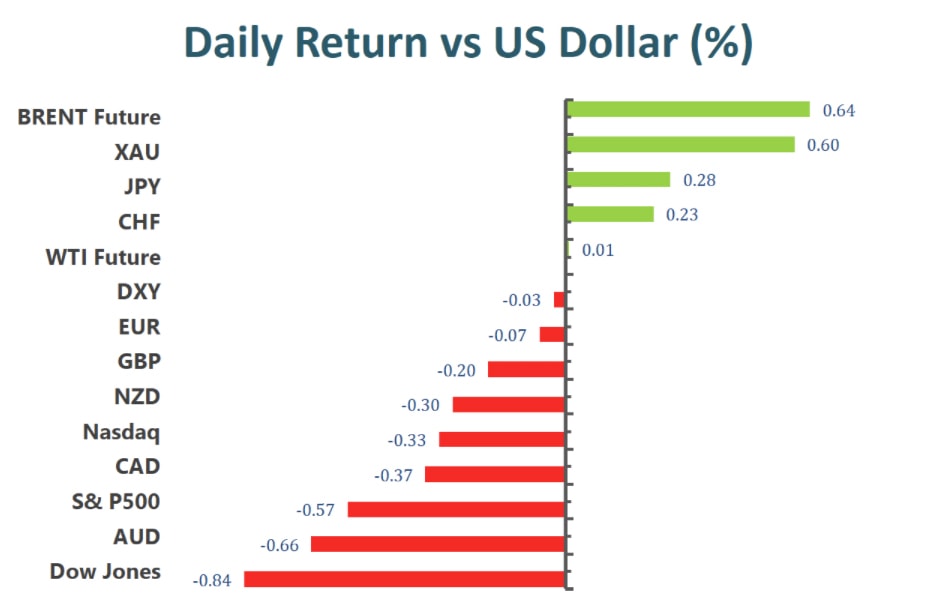
The benchmarks, S&P 500, Dow Jones and the NASDAQ, initially pushed higher following the CPI report, but optimism quickly faded, and the US stock market started facing downward momentum. In conclusion, the influence of the CPI data was overwhelmed by concerns about Delta variant, risks from elevated inflation, slow economic growth and growing chances of a corporate tax rate hike. SP500 posted a 0.6% loss on a daily basis, as the energy and financial sectors are the worst performing group. Dow Jones and the NASDAQ declined 0.8% and 0.3%, respectively.
In Asia, Hong Kong and China’s stock market wavered as investors now focus on the troubles of indebted developer China Evergrande Group. Chinese authorities is facing pressure to find a resolution to a months-long crisis that has intensified obviously in recent days. The company is now dealing with protests by homebuyers, retail investors and employees as it struggles to meet its obligations. Japan’s Nikkei 225 Stock Average, on the contrary, closing at the highest level since 1990.
Main Pairs Movement:
The Bureau of Labor Statistics Core CPI report returned lower than expected price rises in August. The August CPI saw an increase of 0.3%, seasonally adjusted, missing analyst estimates by 4%; these results further validate President Joe Biden and the Fed’s stance that inflation could be temporary and transitory. The energy index increased by 2%, most among all data collected by the BLS, due to the increase of 2.8% in the gasoline index.
Most currency pairs against the U.S. dollar experienced a slight gain at the release of a weaker CPI, but the dollar gained back, and pairs saw a drop. GBP/USD surged at the data release, but would hit its resistance and lose all of its gains during the initial news release. USD/CAD saw a drop during the initial news release, but the dollar quickly repaired loses and successfully defended its support levels. AUD/USD surged at the initial new release, but would go on to drop through our previously estimated support level hours post U.S. CPI release.
Technical Analysis:
GBPUSD (4-hour Chart)
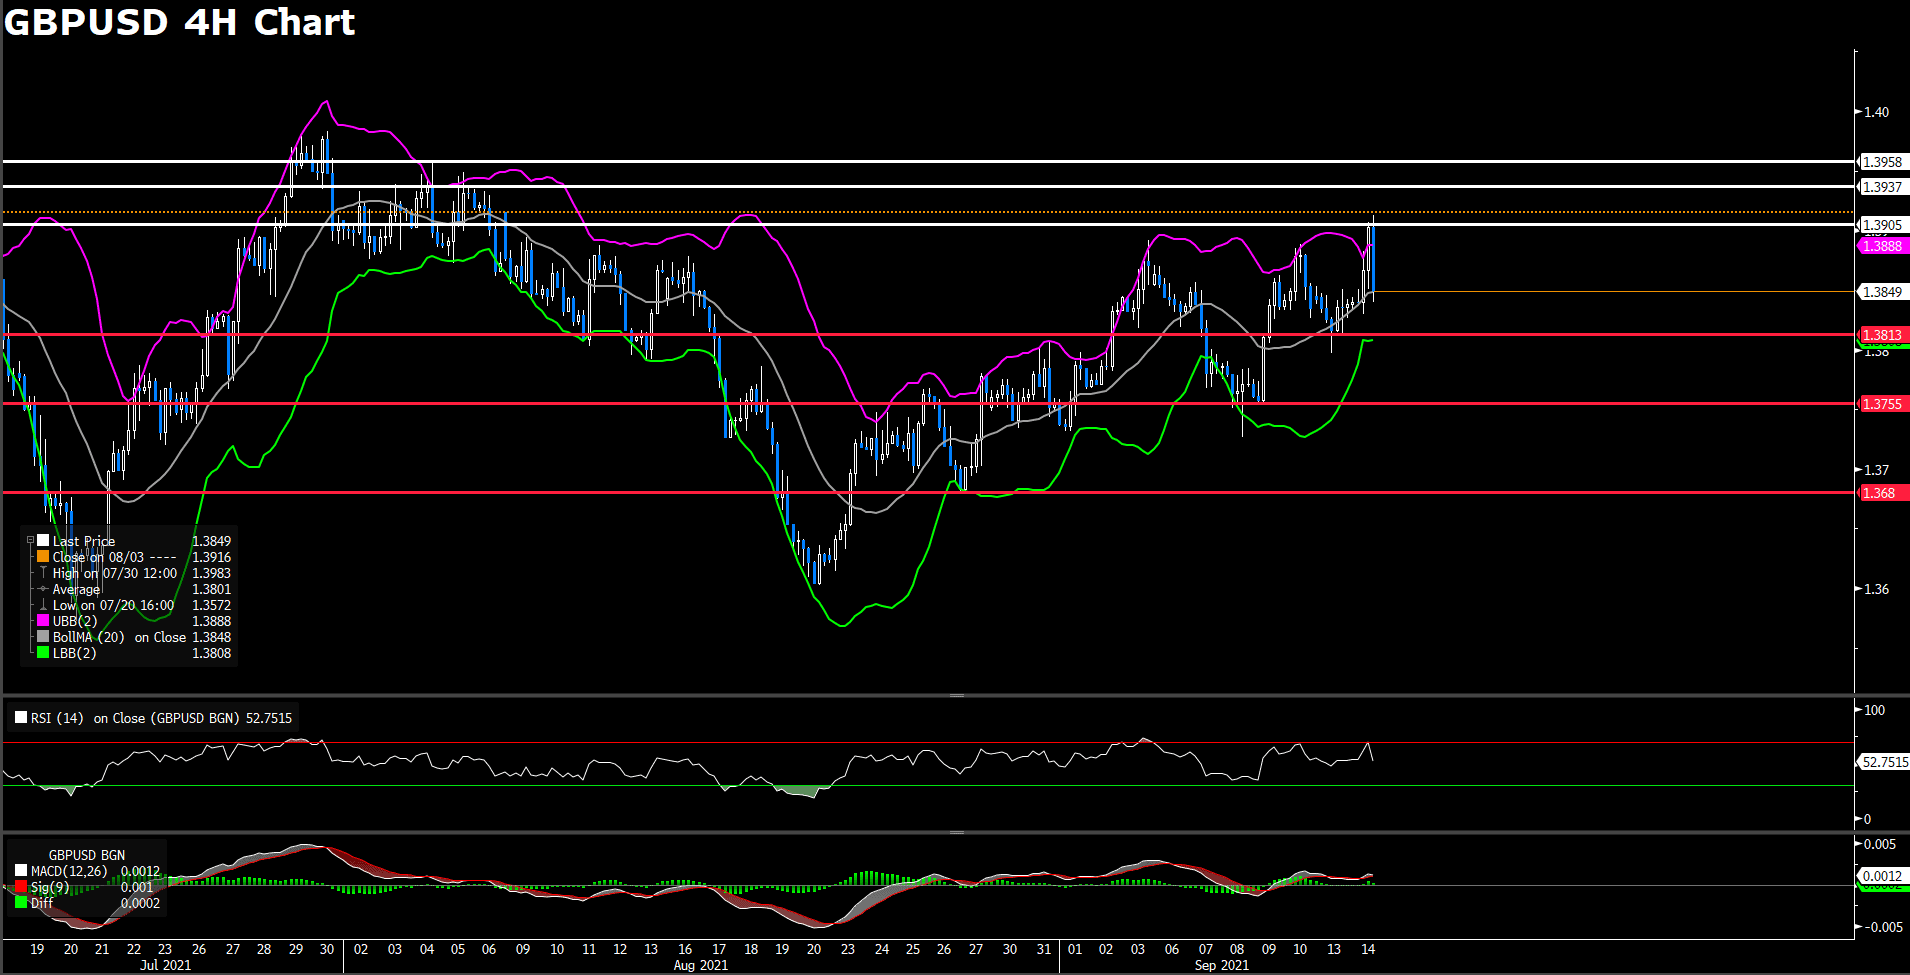
The GBP/USD pair soared by, as much as, 0.4% to its session high of 1.391 right after the BLS released its August CPI report; however, the pair would soon tumble, as much as, 0.54% to 1.383 over the next two hours.As of writing, the pair has found support at 1.383 and is attempting to repair some losses, but Cable has met resistance at the 1.385 price level and is, once again, trending lower. Despite the sharp loss on Tuesday, the pound is still supported by Governor Andrew Bailey and the BOE’s hawkish stance. Speculators are betting that the BOE would continue its hawkish view and hike interest rates by 15 basis points by May of next year.
For technical aspect, GBP/USD is still confined to its month long upward channel. Since the announcement of the U.S. CPI data, RSI for Cable has dropped and is hovering around 53.4, as of writing. Cable has met new resistance at around the 1.39 price level, but long term resistance for the pair still sits at 1.3958.
Resistance: 1.3905, 1.3937, 1.3958
Support: 1.3813, 1.3755, 1.368
USDCAD (4- Hour Chart)
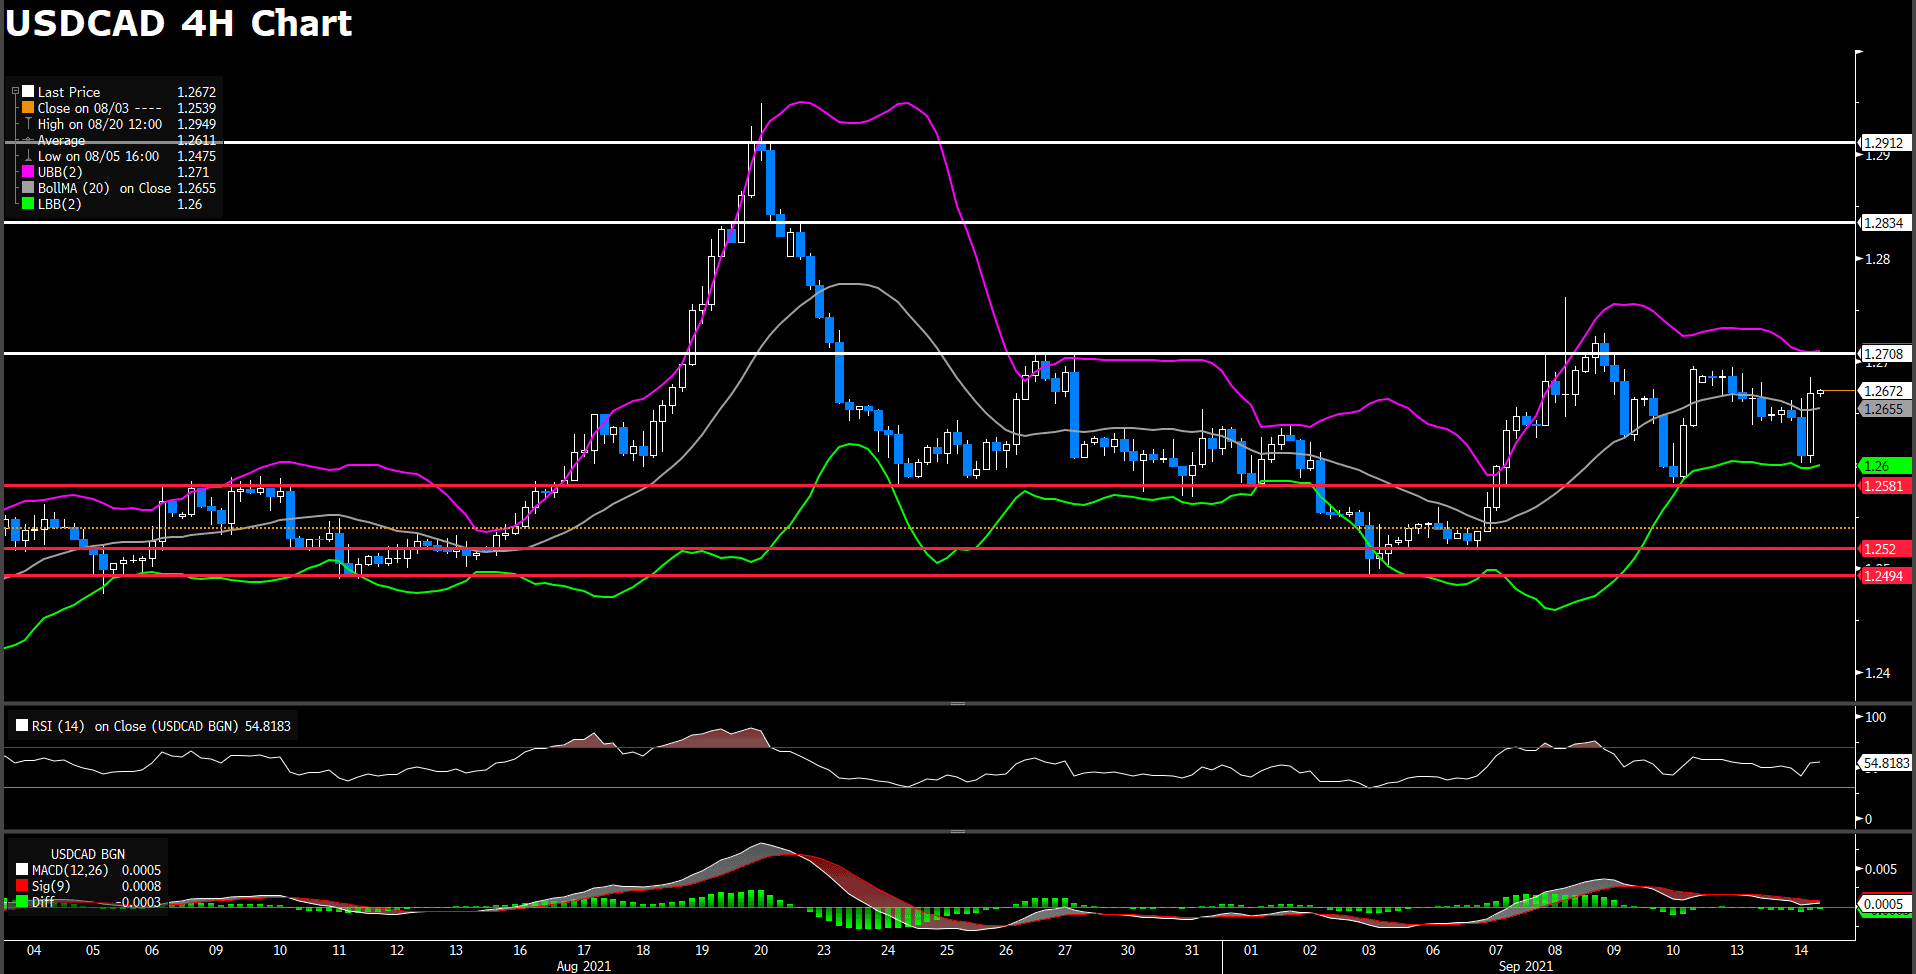
USD/CAD plunged at the release of the U.S. CPI data. The pair lost, as much as, 0.39% to its session low of 1.2605; however, the pair quickly recovered and was able to gain more than 0.5% and reach its session high of 1.268 over the next two hours, post data release. Bearish signals still exist for the loonie, because manufacturing sales in Canada declined by 1.5% (MoM) in July, wose than the market consensus of 1%.
For technical aspect, RSI indicates 54, suggesting a relatively calm market. The pair currently sits at the middle of the Bollinger Bands and is trading above the 50, 100, and 200 day moving average. Despite the rapid price movements for the pair today, USDCAD is still bound in the 1.26 price range and did not fall through our previous support estimate of 1.2581.
Resistance: 1.2708, 1.2834, 1.2912
Support: 1.2589, 1.252, 1.2494
AUDUSD (4- Hour Chart)
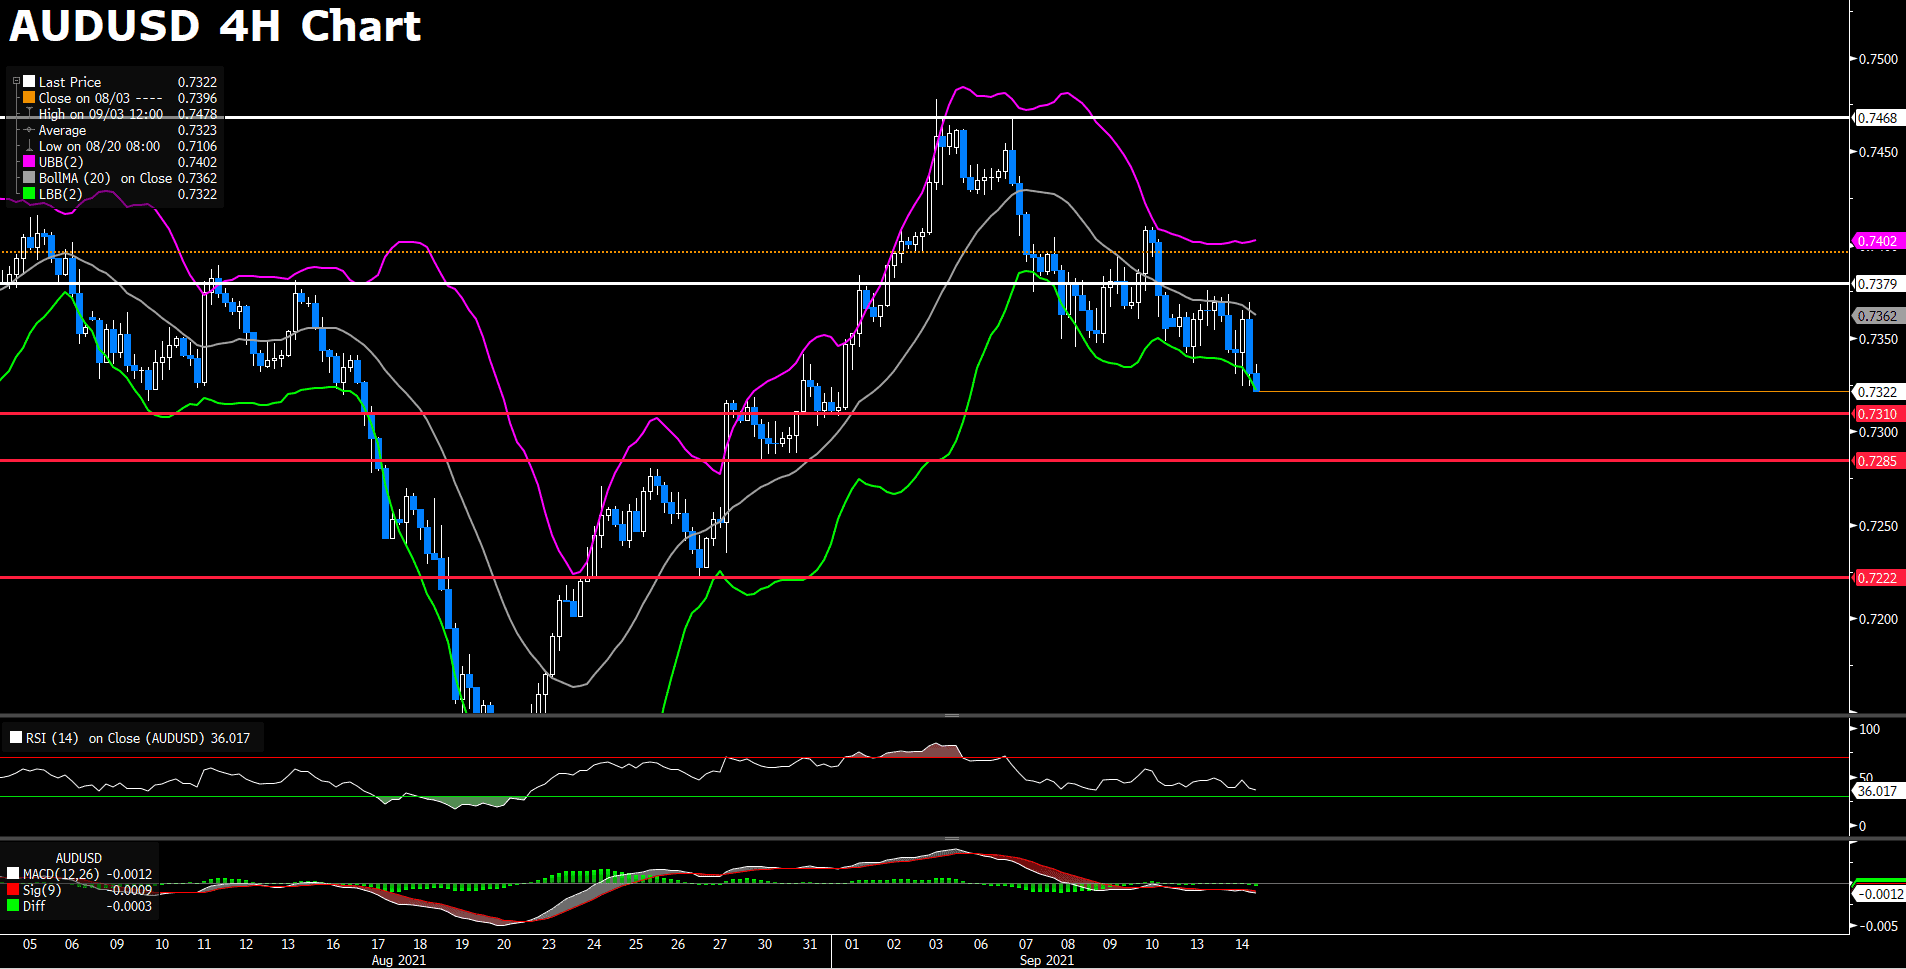
The AUD/USD pair gained 0.4% during the hour of U.S. CPI release but dropped, as much as, 0.61% post U.S. CPI data release; furthermore, the price drop for the pair brought it beneath our previous suppport estimate of 0.7345. AUD remains to be under strong selling pressure in the foreseeable future, due to a dovish central bank, fall in natural resources commodity prices and rising COVID concerns. Despite the Greenback showing weakness due to lower than expected CPI data, the Aussie dollar is still plagued by a dovish central bank stance. On Tuesday, Governer Philip Lowe downplayed the possibility of an, earlier than expected, rate hike.
For technical aspect, RSI indicates 35.2, suggesting weaker buying sentiment. Currently, the pair sits at the lower bound of the Bolliner bands, and the pair is trading below the 50, 100, and 200 day SMA.
Resistance: 0.7379, 0.7468
Support: 0.731, 0.7285, 0.7285, 0.7222
Economic Data
|
Currency |
Data |
Time (GMT + 8) |
Forecast |
||||
|
GBP |
CPI |
14:00 |
2.9% |
||||
|
EUR |
French CPI |
14:45 |
– |
||||
|
CAD |
Core CPI MoM (Aug) |
20:30 |
– |
||||
|
CAD |
CPI |
20:30 |
0.1% |
||||


